 14
14peptides
spectra
0.000 | 0.000
0.000 | 0.000
0.000 | 0.000
0.943 | 0.957
0.000 | 0.000
0.041 | 0.055
0.000 | 0.000
0.000 | 0.000
| Plot | Mito | Lyso | Perox | ER | Golgi | PM | Cytosol | Nucleus | |||||
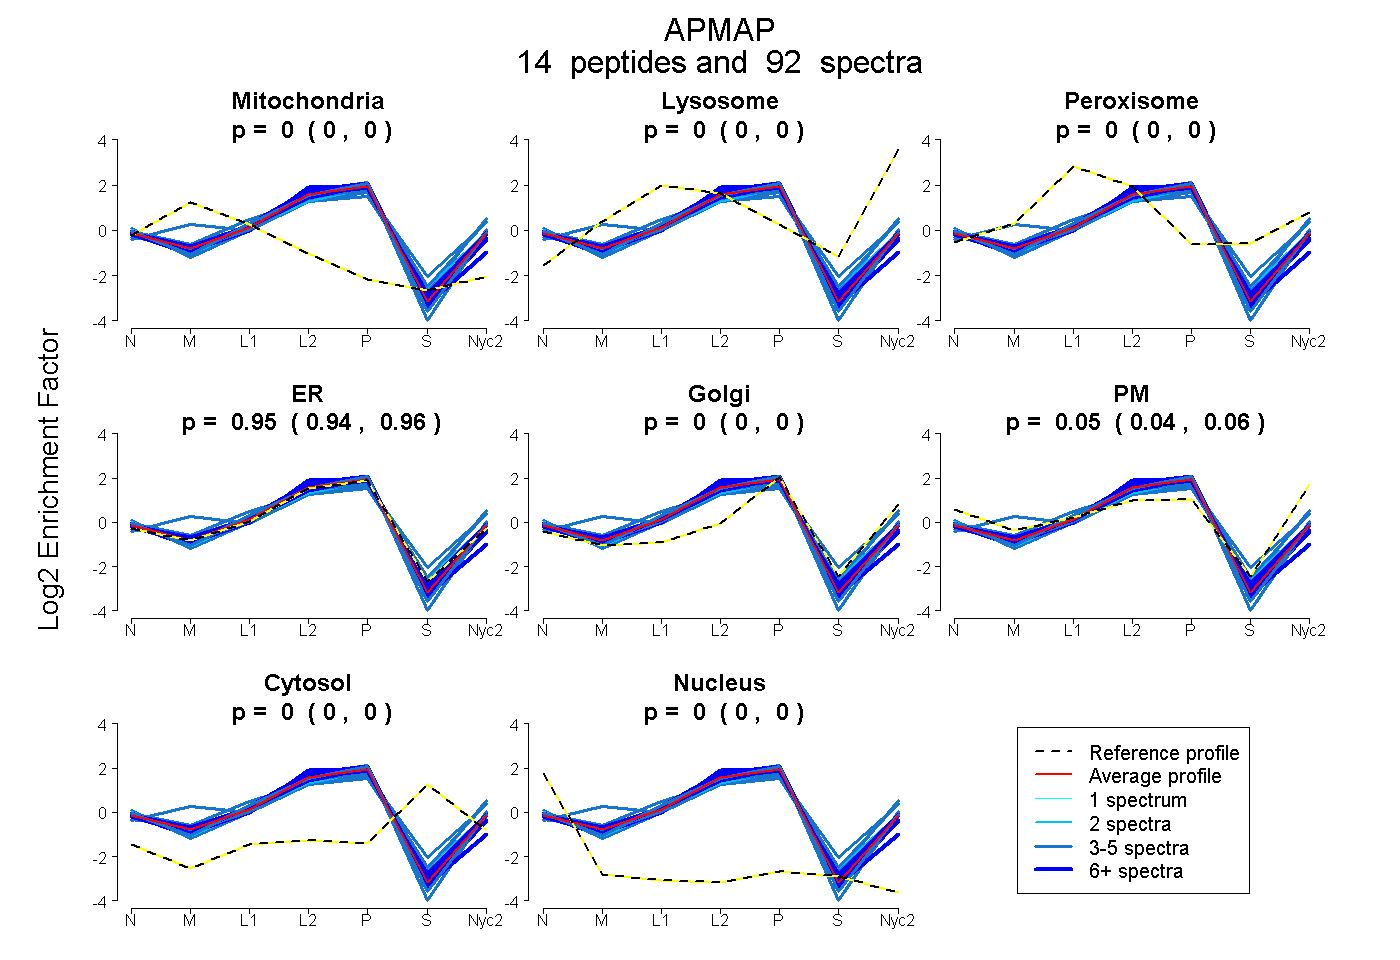
| Expt A |
14 peptides |
92 spectra |
|
0.000 0.000 | 0.000 |
0.000 0.000 | 0.000 |
0.000 0.000 | 0.000 |
0.951 0.943 | 0.957 |
0.000 0.000 | 0.000 |
0.049 0.041 | 0.055 |
0.000 0.000 | 0.000 |
0.000 0.000 | 0.000 |
| 4 spectra, LLEYDTVTK | 0.000 | 0.023 | 0.000 | 0.702 | 0.025 | 0.250 | 0.000 | 0.000 | ||
| 6 spectra, DYLLLVMEGTDDGR | 0.000 | 0.000 | 0.000 | 1.000 | 0.000 | 0.000 | 0.000 | 0.000 | ||
| 9 spectra, VYVSGLMK | 0.011 | 0.000 | 0.000 | 0.989 | 0.000 | 0.000 | 0.000 | 0.000 | ||
| 4 spectra, FGSGPCK | 0.000 | 0.000 | 0.000 | 1.000 | 0.000 | 0.000 | 0.000 | 0.000 | ||
| 19 spectra, SPFICR | 0.024 | 0.000 | 0.000 | 0.953 | 0.000 | 0.000 | 0.000 | 0.023 | ||
| 3 spectra, DDEPTCGRPLGIR | 0.145 | 0.055 | 0.000 | 0.800 | 0.000 | 0.000 | 0.000 | 0.000 | ||
| 3 spectra, LLLSSETPIEGK | 0.000 | 0.000 | 0.000 | 1.000 | 0.000 | 0.000 | 0.000 | 0.000 | ||
| 2 spectra, IYFTDSSSK | 0.000 | 0.000 | 0.000 | 0.837 | 0.039 | 0.099 | 0.000 | 0.024 | ||
| 4 spectra, YSLVLEVSDSGAFR | 0.000 | 0.000 | 0.000 | 0.970 | 0.000 | 0.030 | 0.000 | 0.000 | ||
| 5 spectra, LFSQETVMK | 0.000 | 0.000 | 0.000 | 0.972 | 0.000 | 0.028 | 0.000 | 0.000 | ||
| 3 spectra, GLFEVNPQK | 0.000 | 0.000 | 0.000 | 0.656 | 0.000 | 0.270 | 0.073 | 0.000 | ||
| 11 spectra, LENGEIETIAR | 0.000 | 0.000 | 0.000 | 0.973 | 0.000 | 0.027 | 0.000 | 0.000 | ||
| 4 spectra, EPPFMFGVLQPNTK | 0.000 | 0.041 | 0.009 | 0.642 | 0.000 | 0.308 | 0.000 | 0.000 | ||
| 15 spectra, MSFVNDLTITR | 0.000 | 0.000 | 0.000 | 1.000 | 0.000 | 0.000 | 0.000 | 0.000 |
| Plot | Mito | Lyso or Perox | ER | Golgi | PM | Cytosol | Nucleus | ||||||
| Expt B |
10 peptides |
20 spectra |
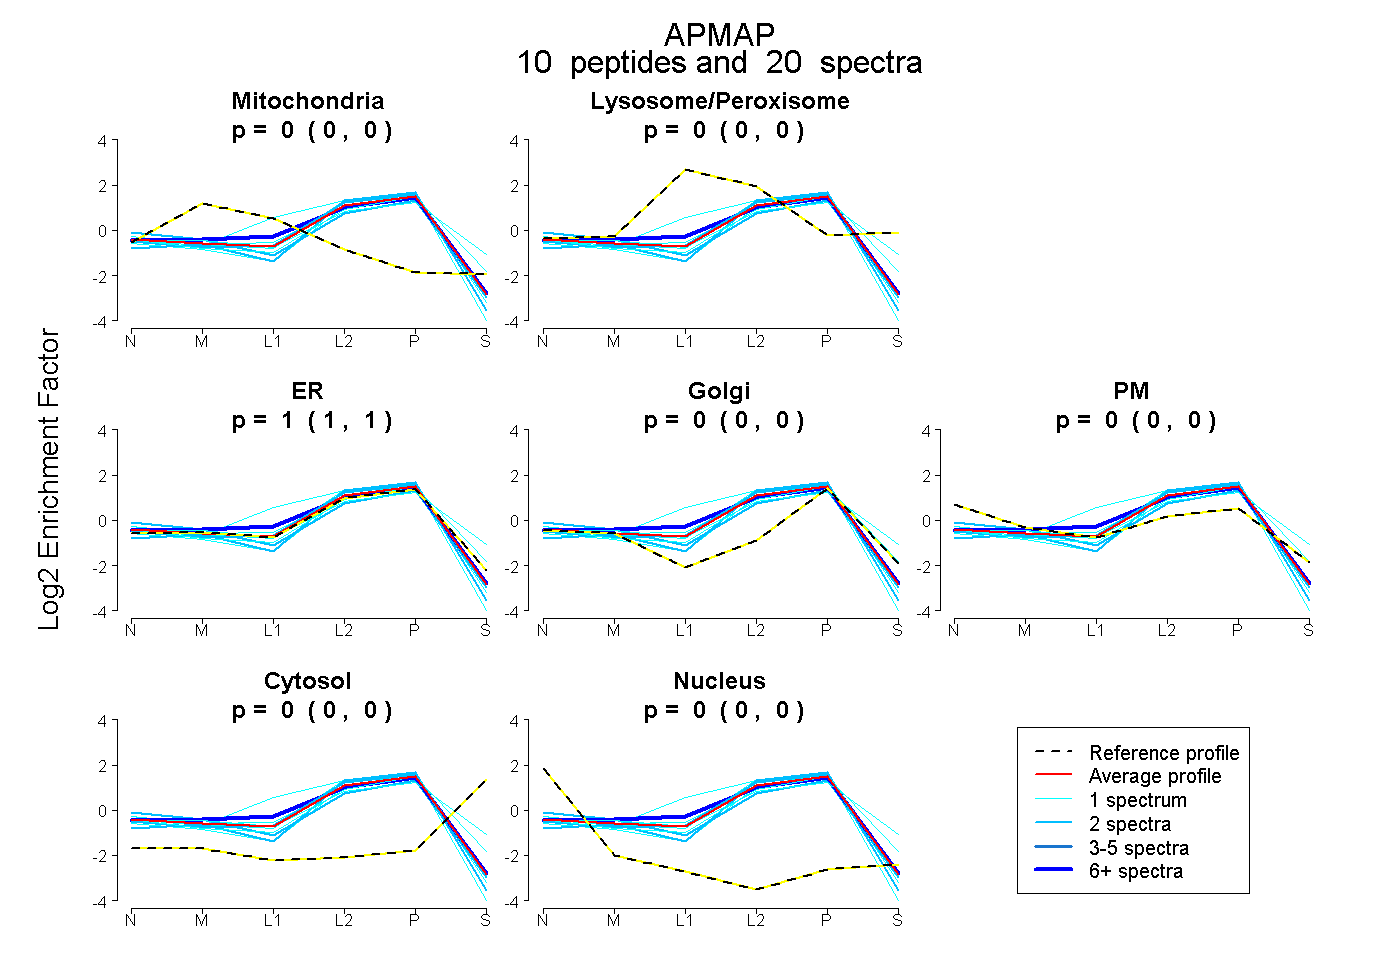 |
0.000 0.000 | 0.000 |
0.000 0.000 | 0.000 |
1.000 1.000 | 1.000 |
0.000 0.000 | 0.000 |
0.000 0.000 | 0.000 |
0.000 0.000 | 0.000 |
0.000 0.000 | 0.000 |
|||
| Plot | Lyso | Other | |||||||||||
| Expt C |
15 peptides |
153 spectra |
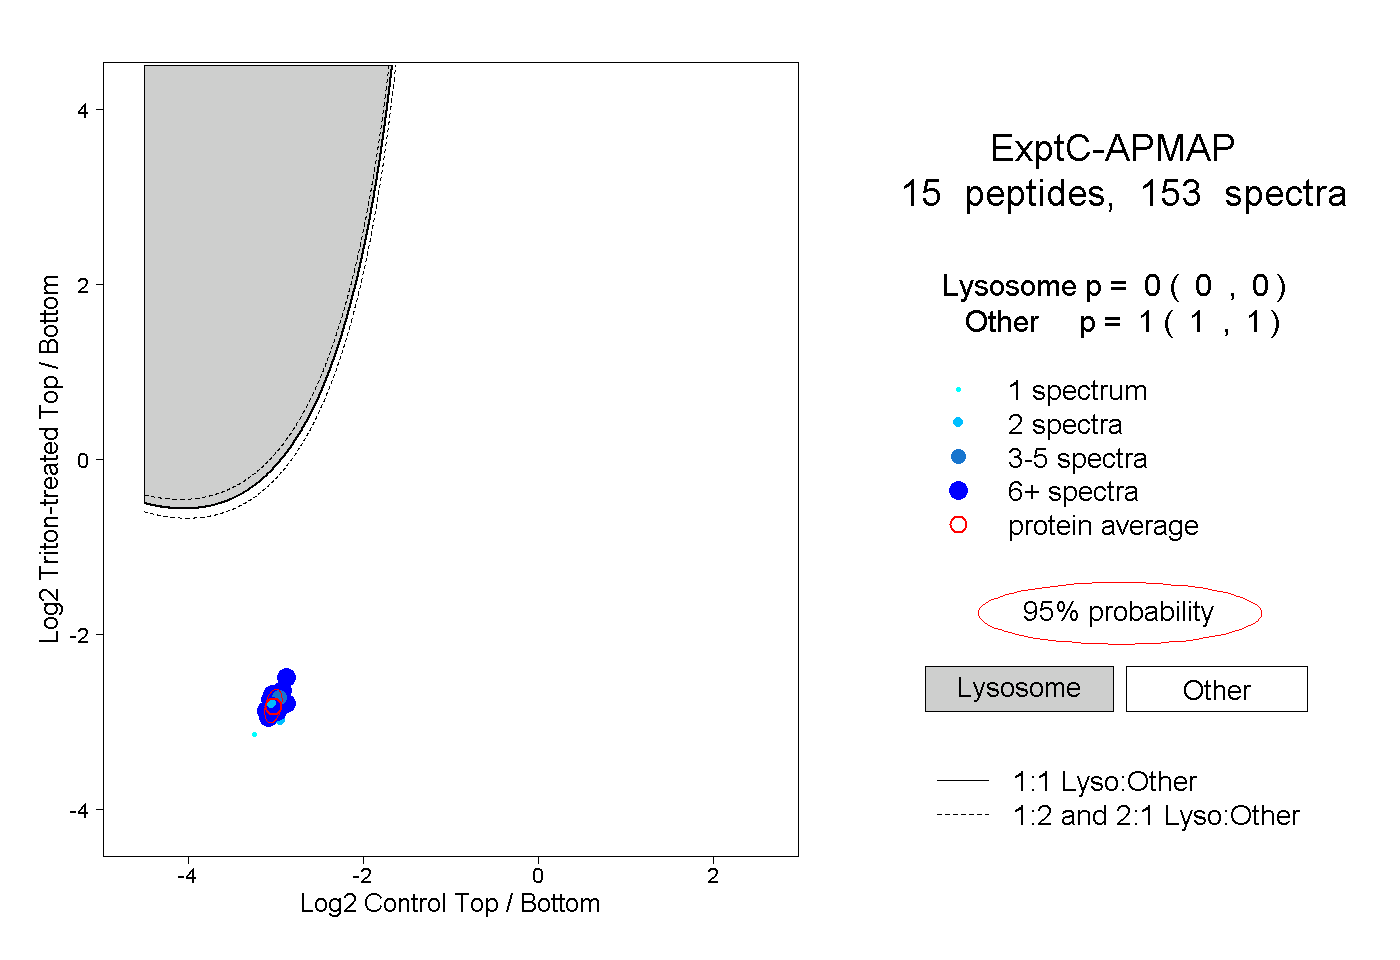 |
0.000 0.000 | 0.000 |
1.000 1.000 | 1.000 |
||||||||
| Plot | Lyso | Other | |||||||||||
| Expt D |
7 peptides |
24 spectra |
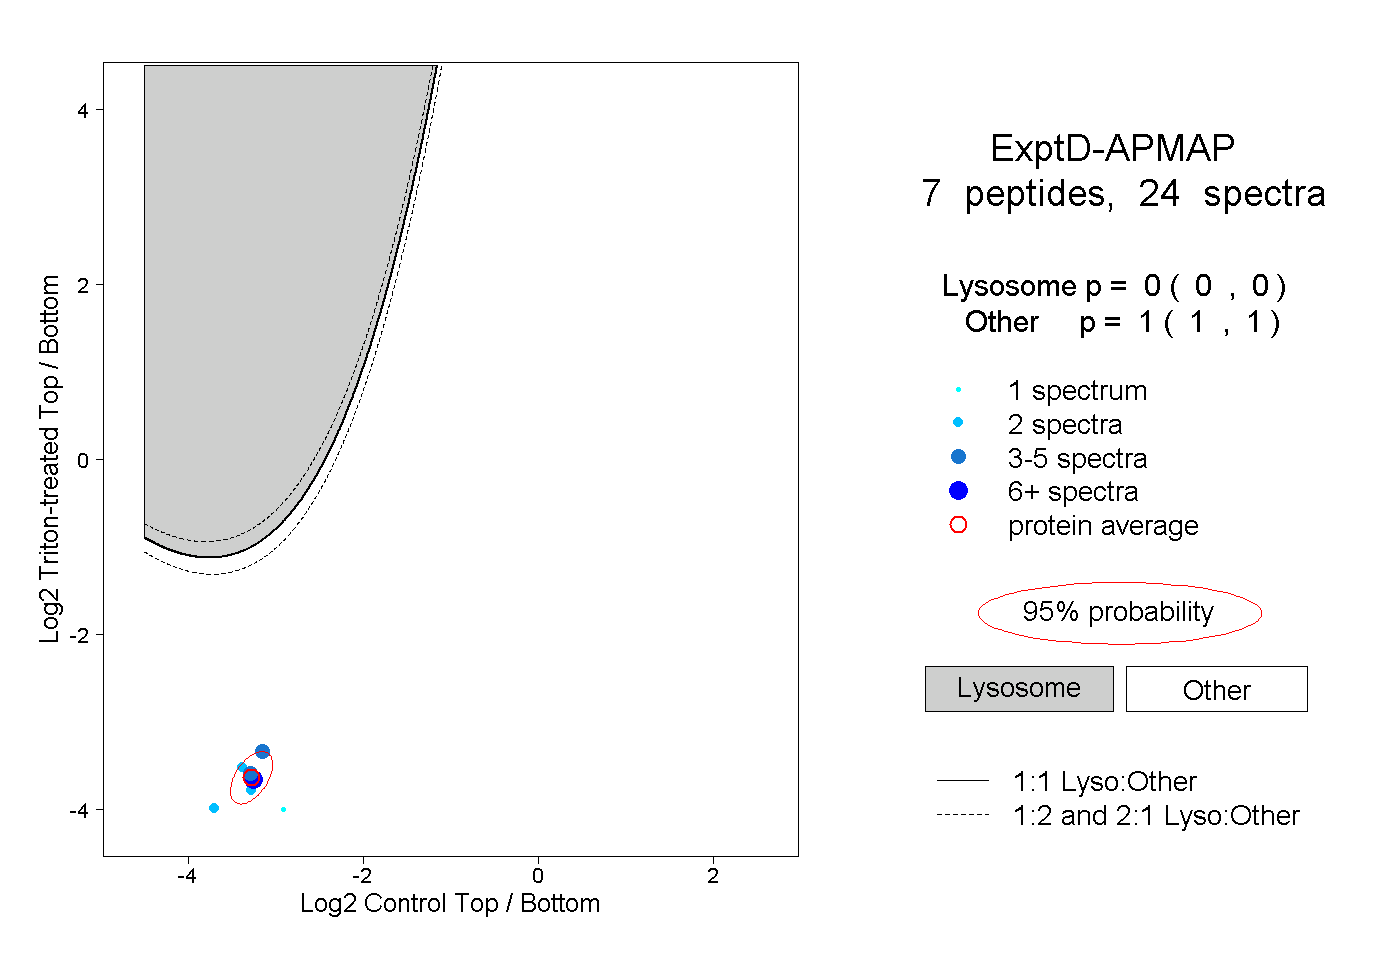 |
0.000 0.000 | 0.000 |
1.000 1.000 | 1.000 |