 12
12peptides
spectra
0.017 | 0.055
0.000 | 0.000
0.009 | 0.047
0.818 | 0.852
0.000 | 0.000
0.000 | 0.000
0.022 | 0.069
0.037 | 0.060
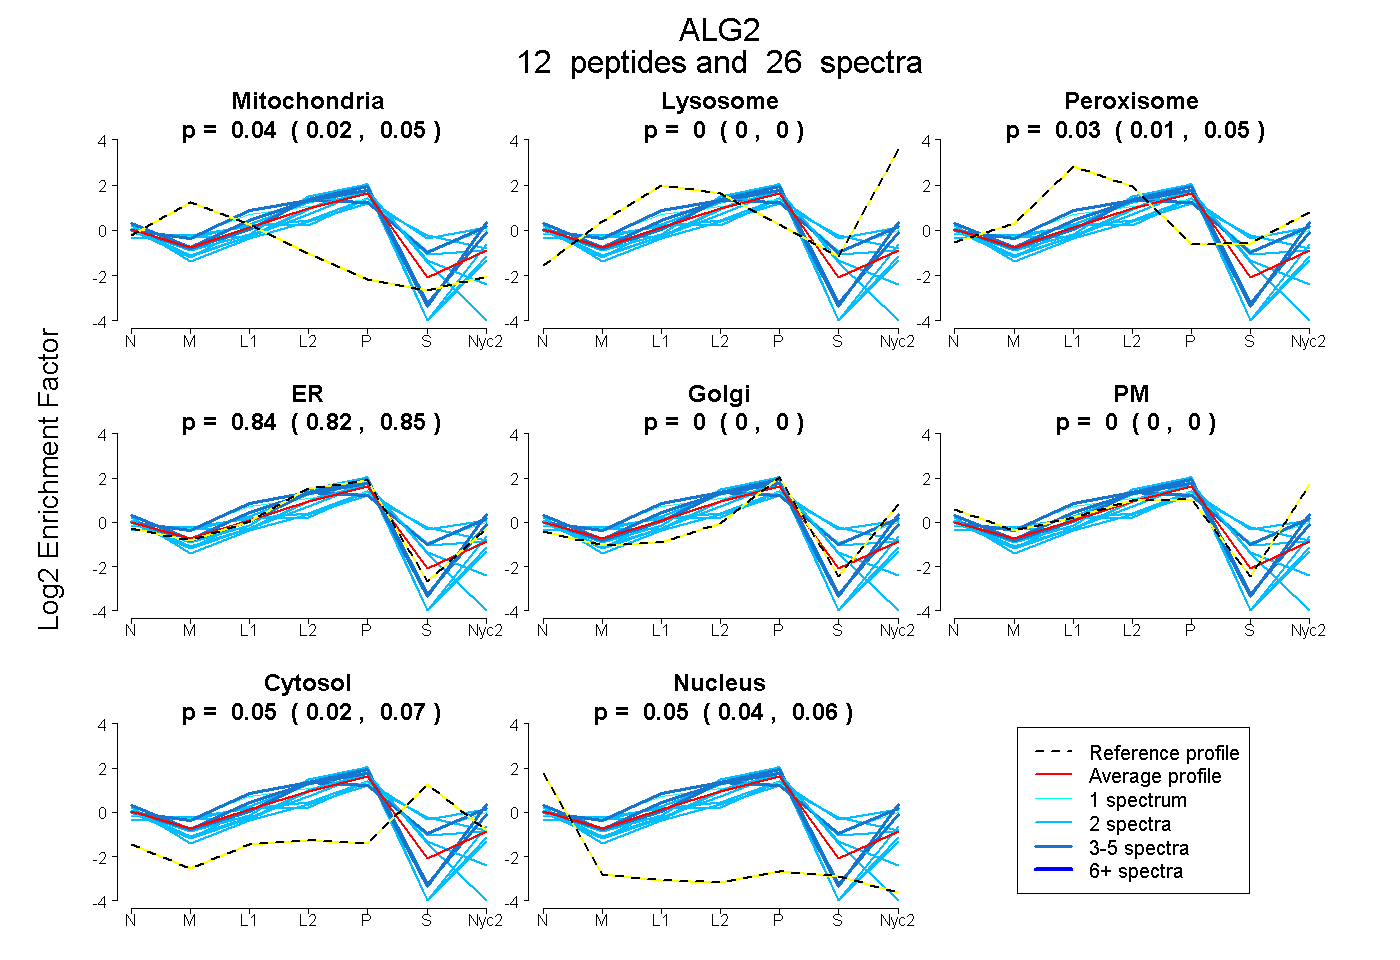
| Plot | Mito | Lyso | Perox | ER | Golgi | PM | Cytosol | Nucleus | |||||
| Expt A |
12 peptides |
26 spectra |
|
0.037 0.017 | 0.055 |
0.000 0.000 | 0.000 |
0.029 0.009 | 0.047 |
0.837 0.818 | 0.852 |
0.000 0.000 | 0.000 |
0.000 0.000 | 0.000 |
0.047 0.022 | 0.069 |
0.050 0.037 | 0.060 |
| 2 spectra, HVTFLR | 0.000 | 0.000 | 0.217 | 0.157 | 0.382 | 0.000 | 0.244 | 0.000 | ||
| 3 spectra, SLGWGGR | 0.000 | 0.000 | 0.000 | 0.884 | 0.010 | 0.094 | 0.000 | 0.011 | ||
| 2 spectra, LVLDAALALQEYGCQVK | 0.009 | 0.000 | 0.000 | 0.706 | 0.000 | 0.000 | 0.043 | 0.242 | ||
| 2 spectra, VLENVEHYK | 0.000 | 0.000 | 0.000 | 0.759 | 0.000 | 0.000 | 0.123 | 0.118 | ||
| 3 spectra, VHLFMAGGYDDR | 0.000 | 0.000 | 0.378 | 0.425 | 0.116 | 0.016 | 0.066 | 0.000 | ||
| 1 spectrum, IWTAHYDPNHCFIETR | 0.000 | 0.000 | 0.335 | 0.414 | 0.159 | 0.000 | 0.092 | 0.000 | ||
| 2 spectra, GAAICSYVR | 0.106 | 0.000 | 0.092 | 0.594 | 0.031 | 0.000 | 0.176 | 0.000 | ||
| 2 spectra, ATMGLAGK | 0.071 | 0.000 | 0.000 | 0.878 | 0.000 | 0.000 | 0.000 | 0.051 | ||
| 3 spectra, VYSPSVLFLHPDMGIGGAER | 0.000 | 0.000 | 0.000 | 0.676 | 0.000 | 0.324 | 0.000 | 0.000 | ||
| 2 spectra, FIHKPSLK | 0.000 | 0.000 | 0.012 | 0.589 | 0.000 | 0.000 | 0.399 | 0.000 | ||
| 2 spectra, QFLFLSINR | 0.000 | 0.000 | 0.000 | 0.962 | 0.000 | 0.000 | 0.000 | 0.038 | ||
| 2 spectra, ELSVQCAGDWLPR | 0.112 | 0.000 | 0.000 | 0.877 | 0.000 | 0.000 | 0.000 | 0.011 |
| Plot | Mito | Lyso or Perox | ER | Golgi | PM | Cytosol | Nucleus | ||||||
| Expt B |
3 peptides |
5 spectra |
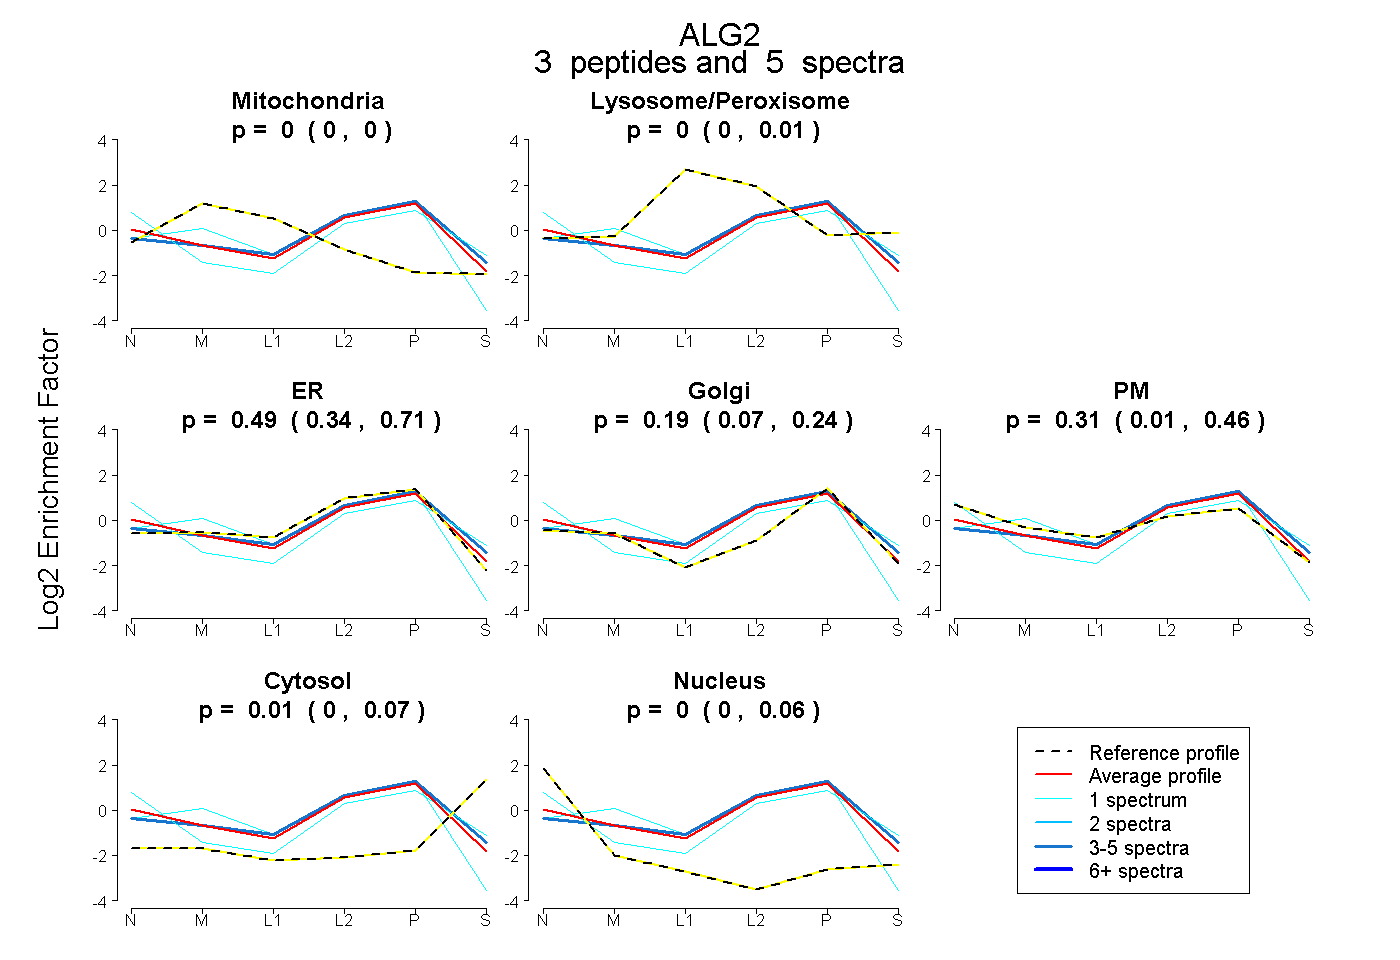 |
0.000 0.000 | 0.000 |
0.000 0.000 | 0.014 |
0.488 0.339 | 0.707 |
0.189 0.068 | 0.244 |
0.314 0.014 | 0.458 |
0.009 0.000 | 0.073 |
0.000 0.000 | 0.057 |
|||
| Plot | Lyso | Other | |||||||||||
| Expt C |
7 peptides |
16 spectra |
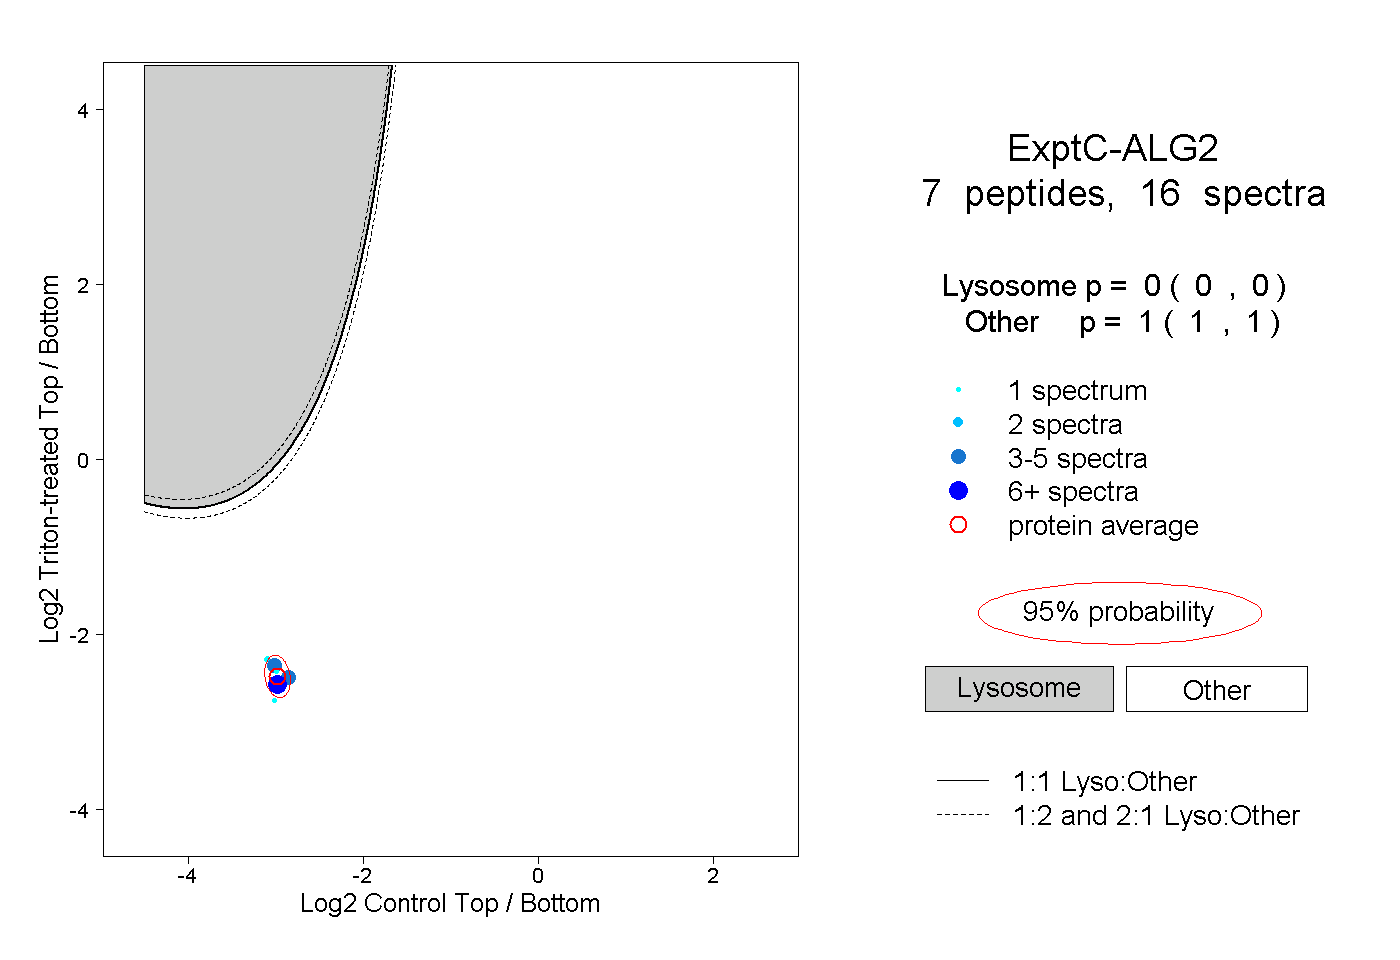 |
0.000 0.000 | 0.000 |
1.000 1.000 | 1.000 |
||||||||
| Plot | Lyso | Other | |||||||||||
| Expt D |
3 peptides |
4 spectra |
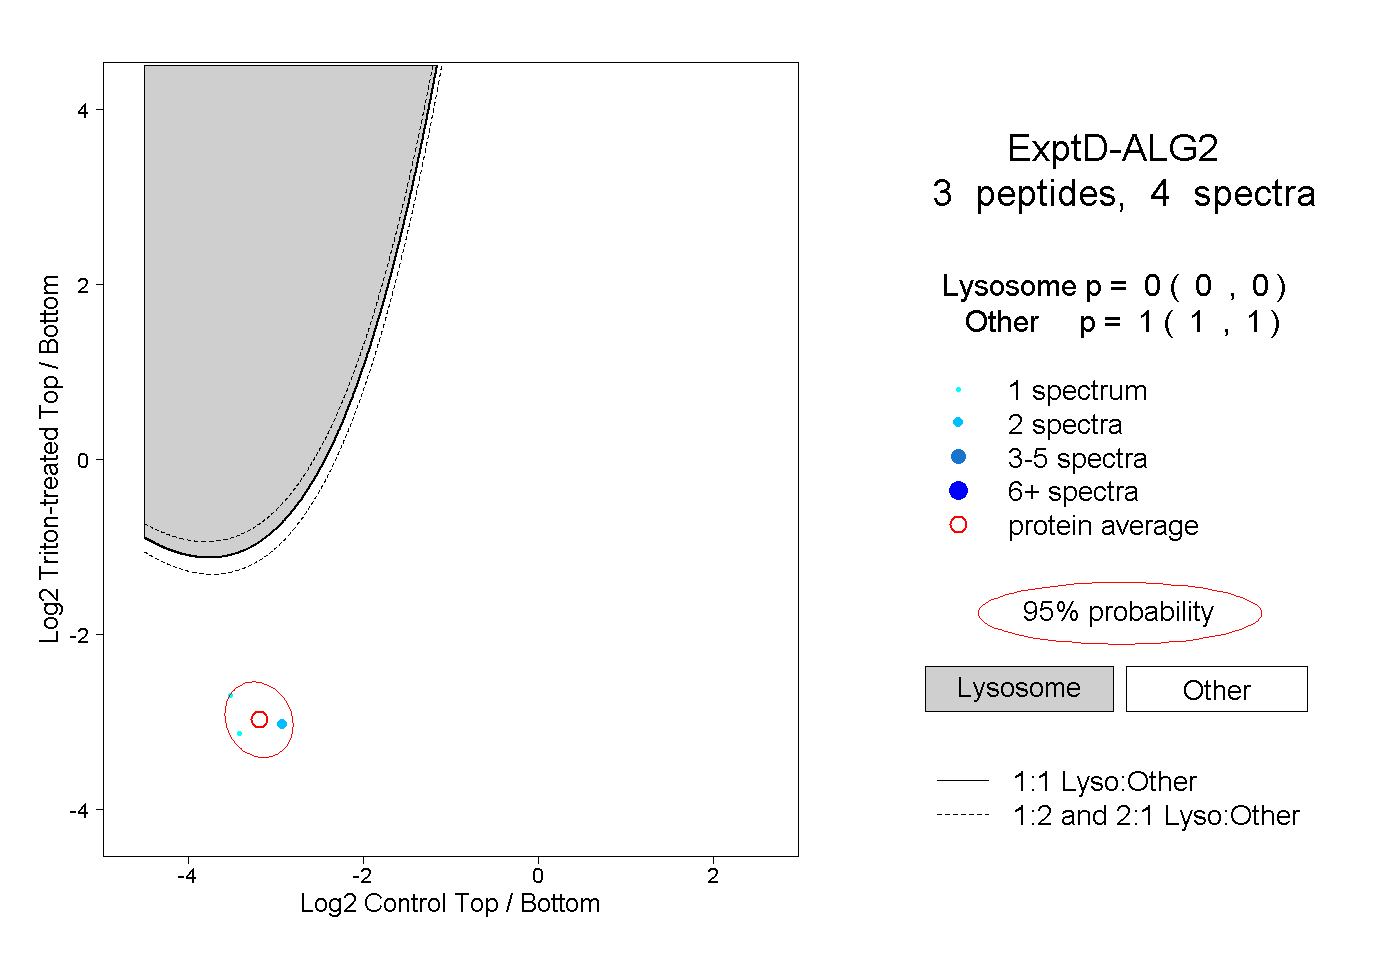 |
0.000 0.000 | 0.000 |
1.000 1.000 | 1.000 |