 27
27peptides
spectra
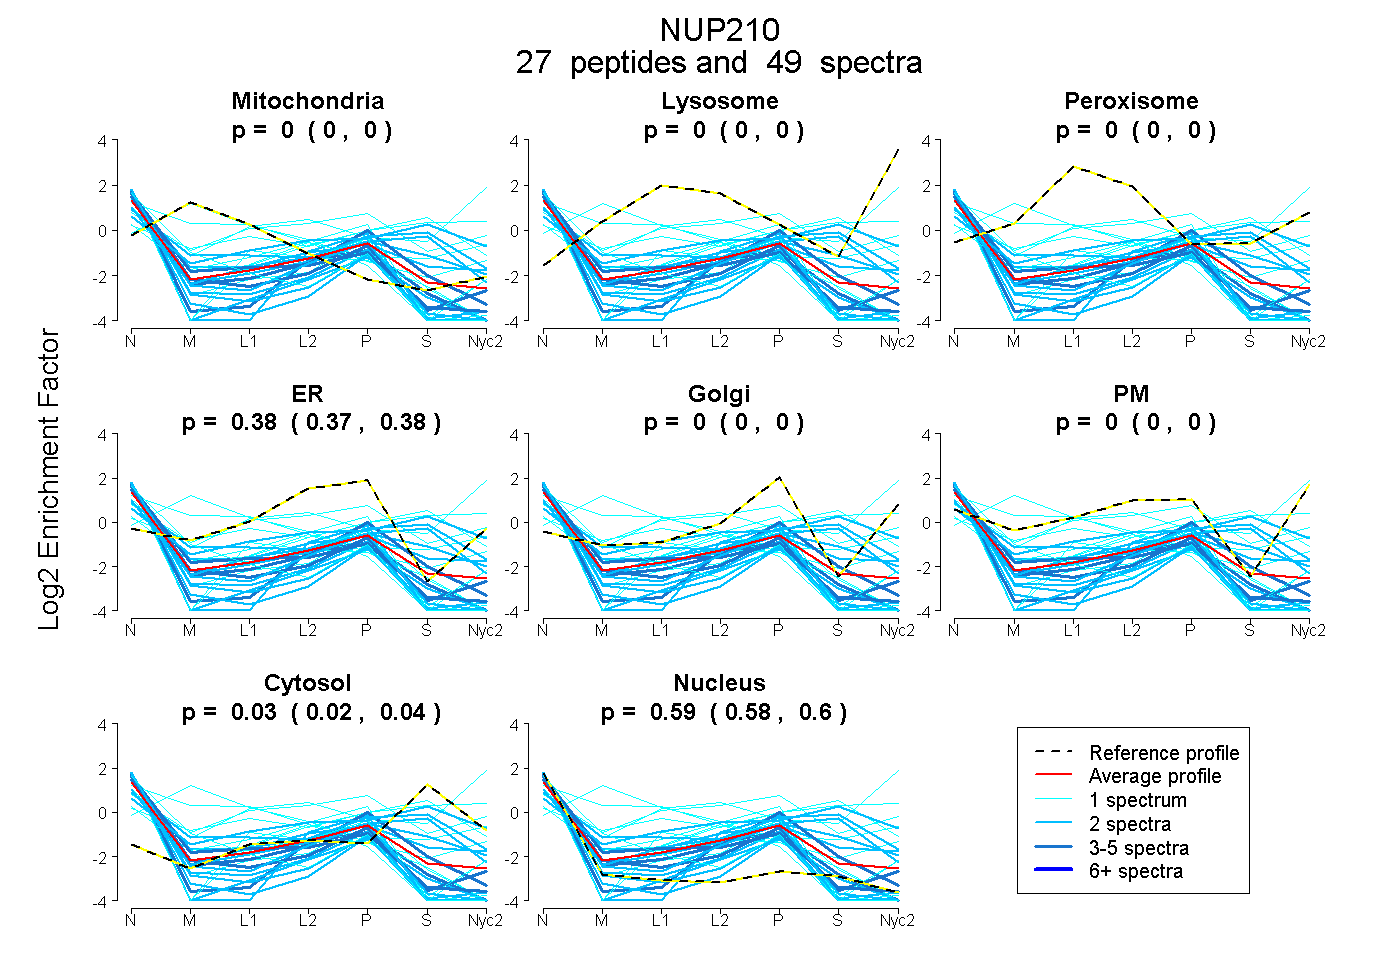
0.000 | 0.000
0.000 | 0.000
0.000 | 0.000
0.366 | 0.383
0.000 | 0.000
0.000 | 0.000
0.015 | 0.043
0.584 | 0.602
3peptides
spectra
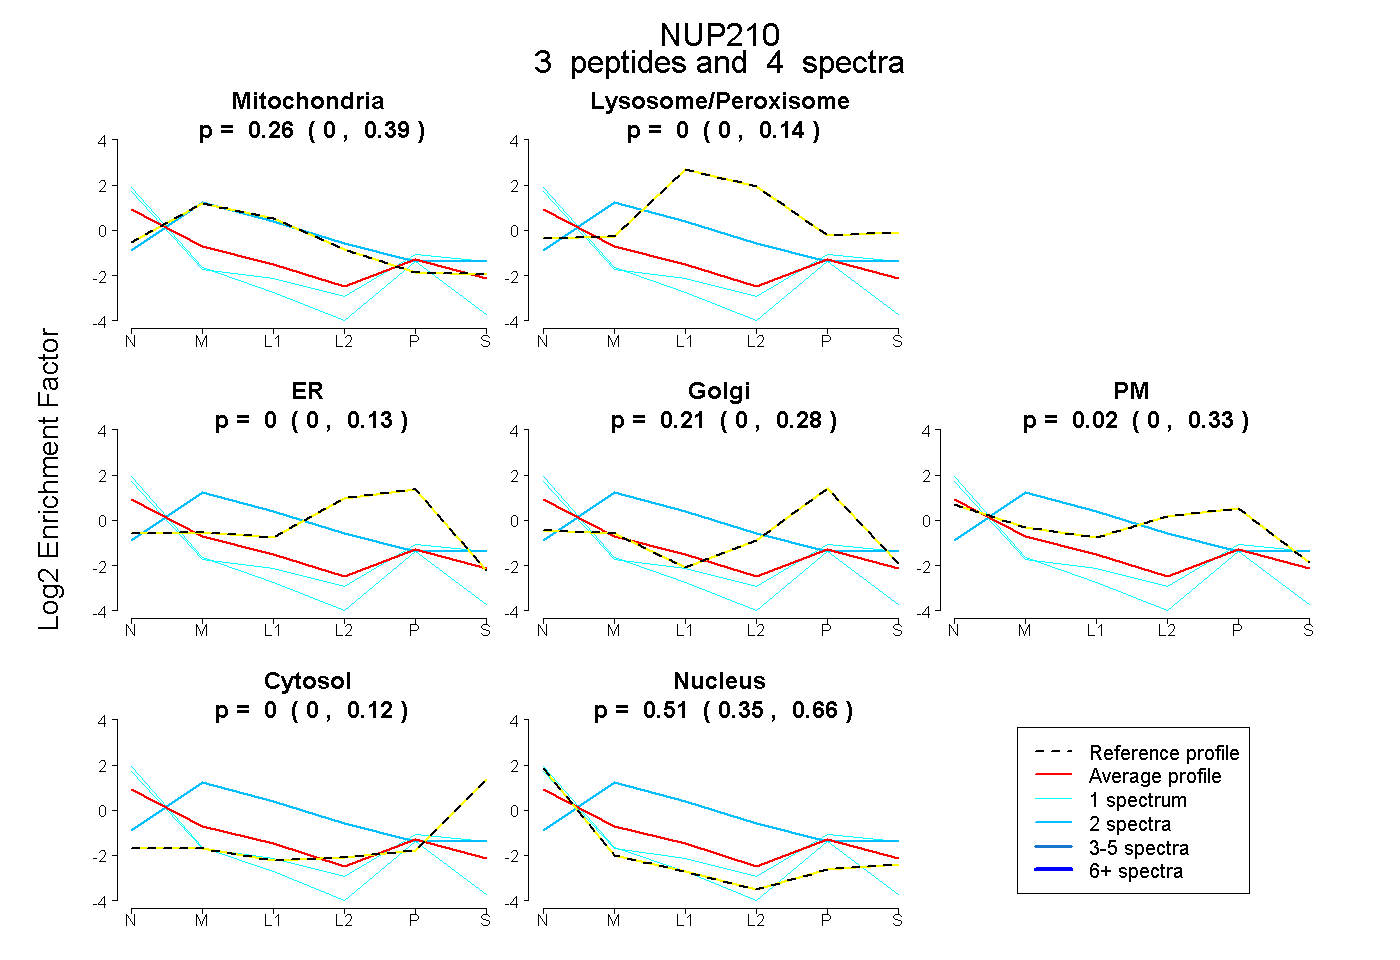
0.000 | 0.389
0.000 | 0.144
0.000 | 0.134
0.000 | 0.280
0.000 | 0.327
0.000 | 0.116
0.351 | 0.662