 17
17peptides
spectra
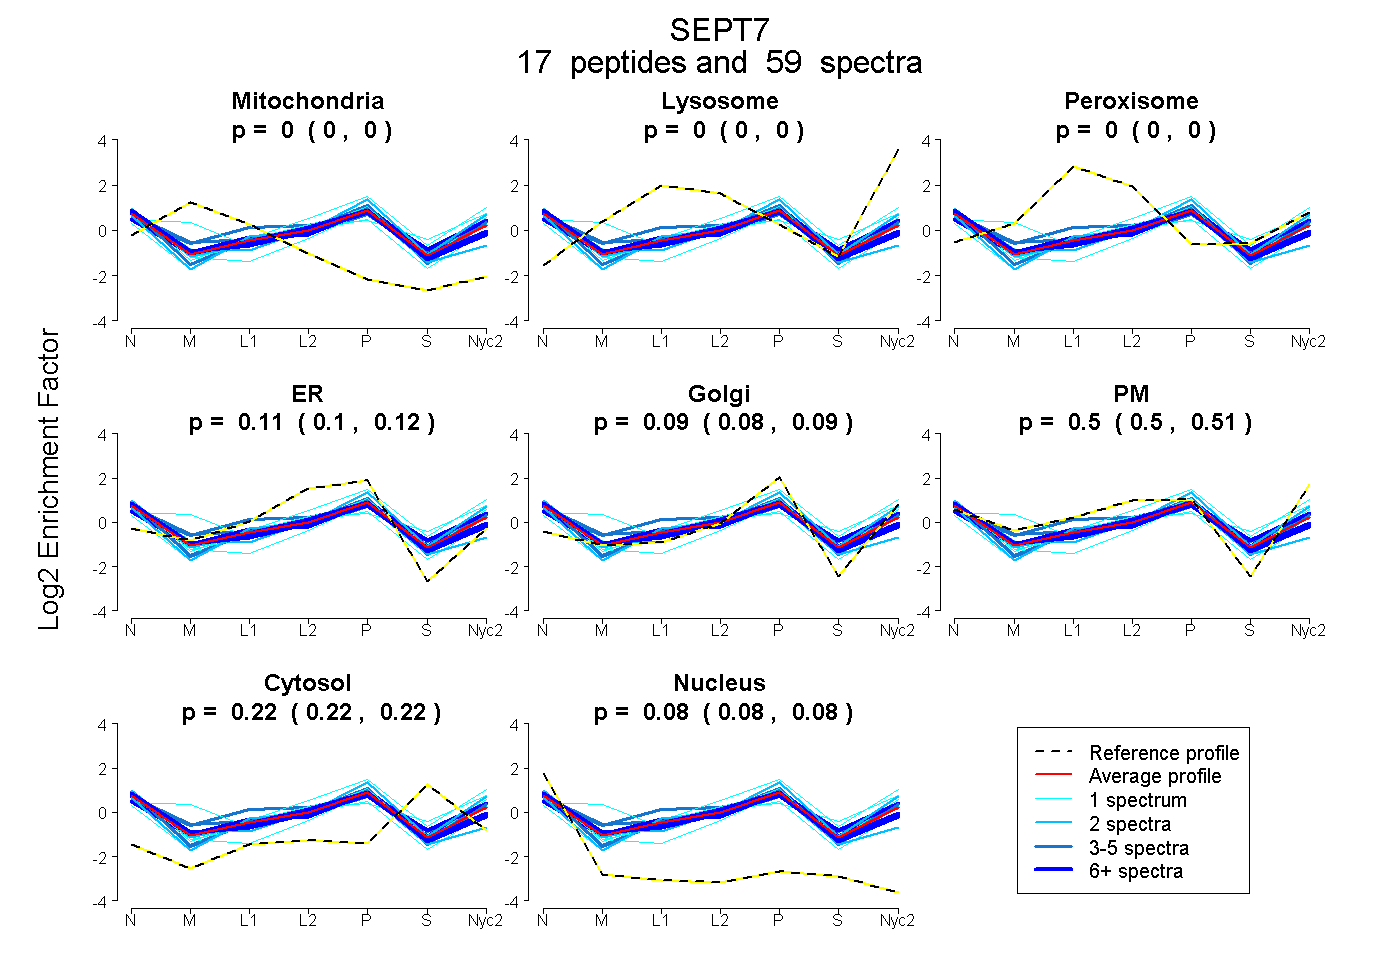
0.000 | 0.000
0.000 | 0.000
0.000 | 0.000
0.100 | 0.117
0.079 | 0.095
0.496 | 0.511
0.216 | 0.222
0.078 | 0.082
6peptides
spectra
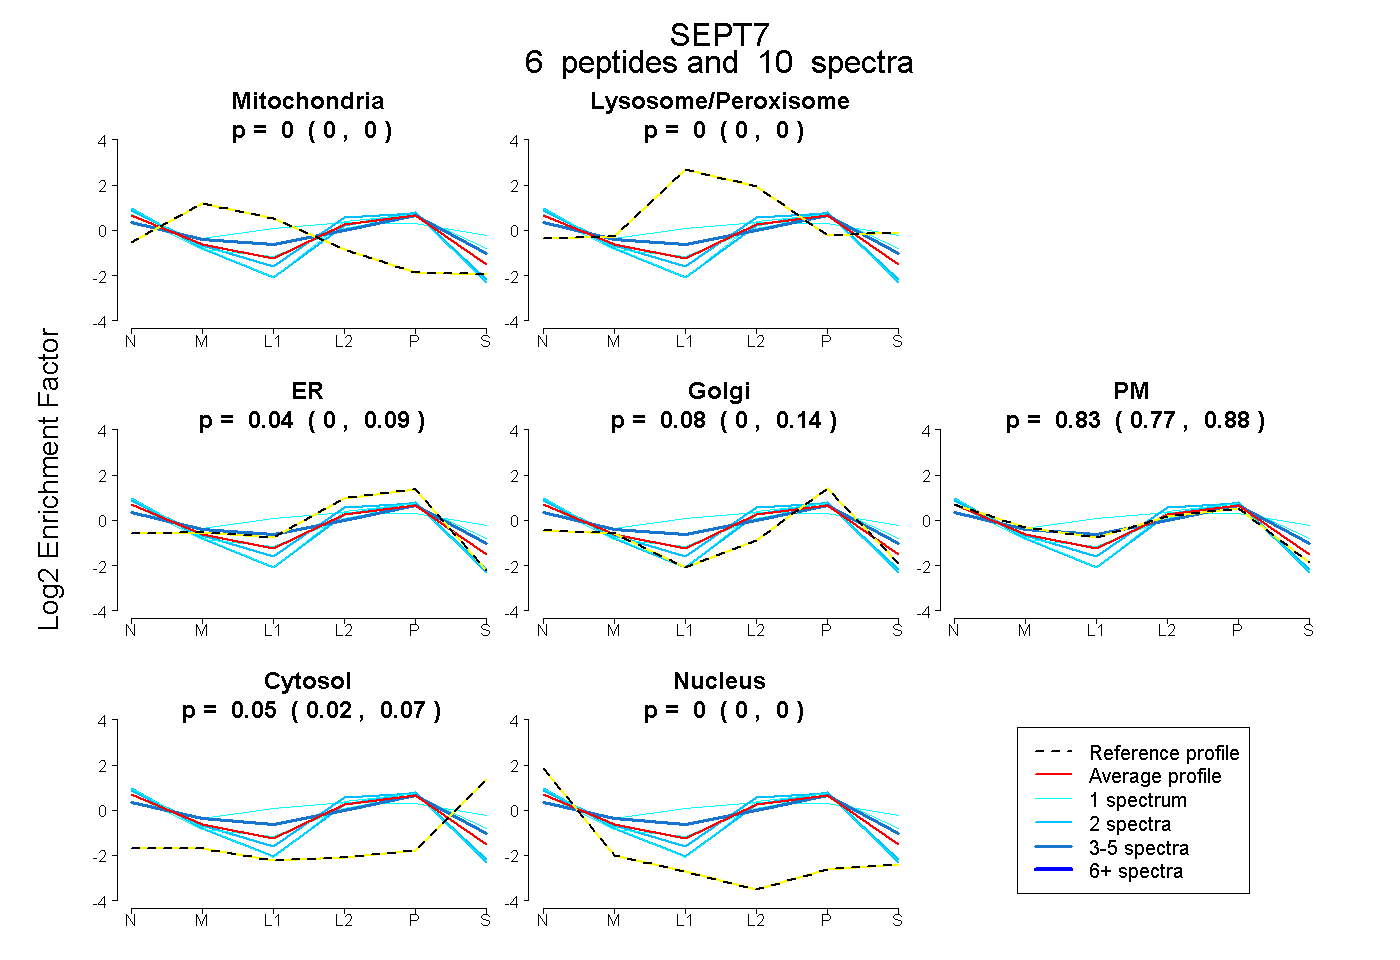
0.000 | 0.000
0.000 | 0.000
0.000 | 0.087
0.002 | 0.143
0.767 | 0.879
0.016 | 0.073
0.000 | 0.002
16peptides
spectra
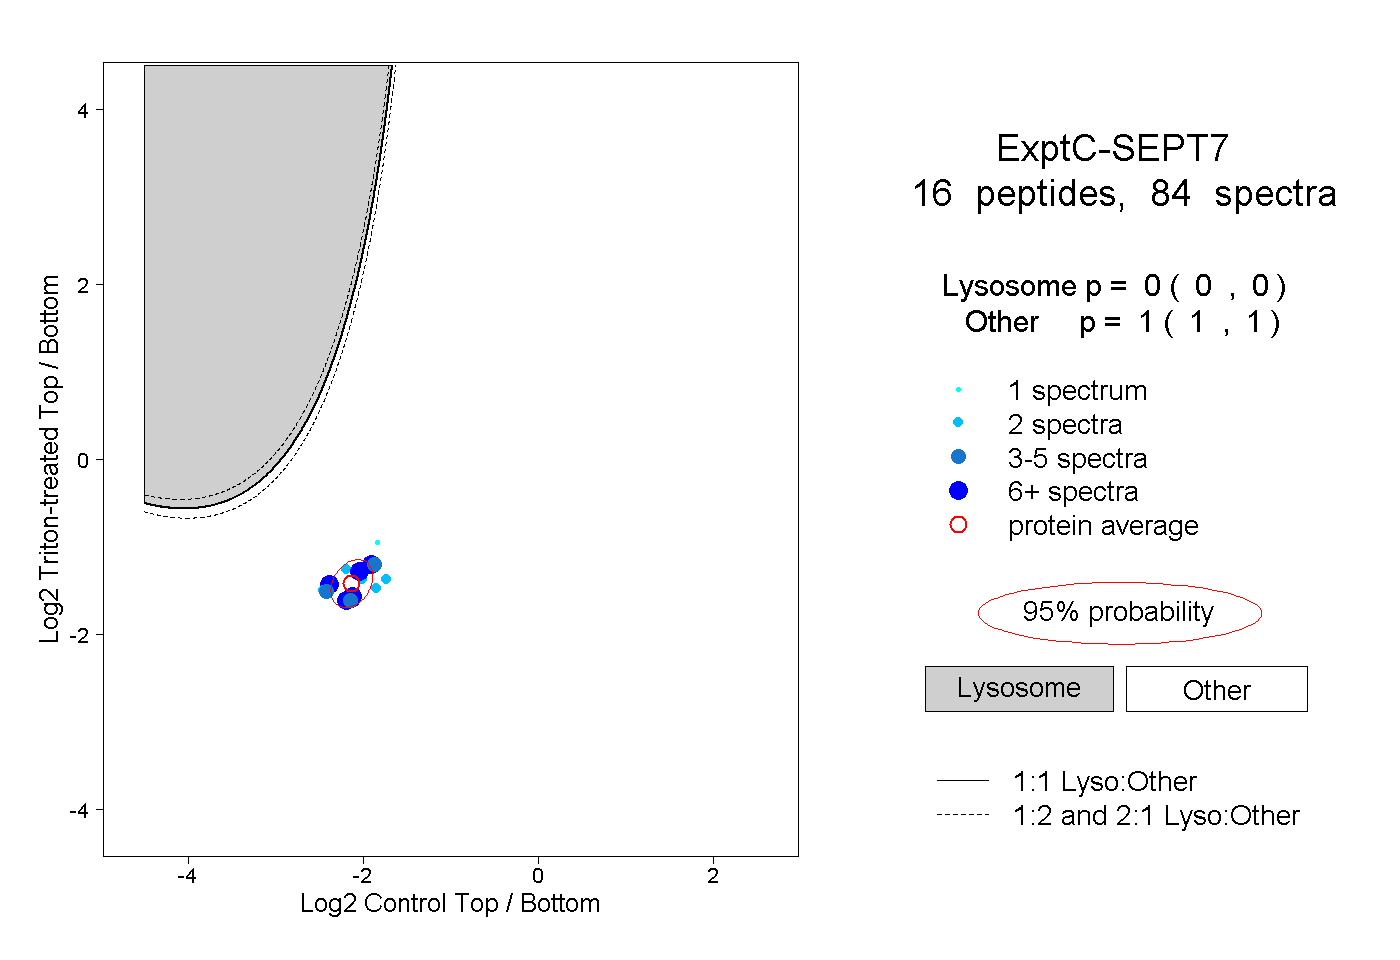
0.000 | 0.000
1.000 | 1.000
5peptides
spectra
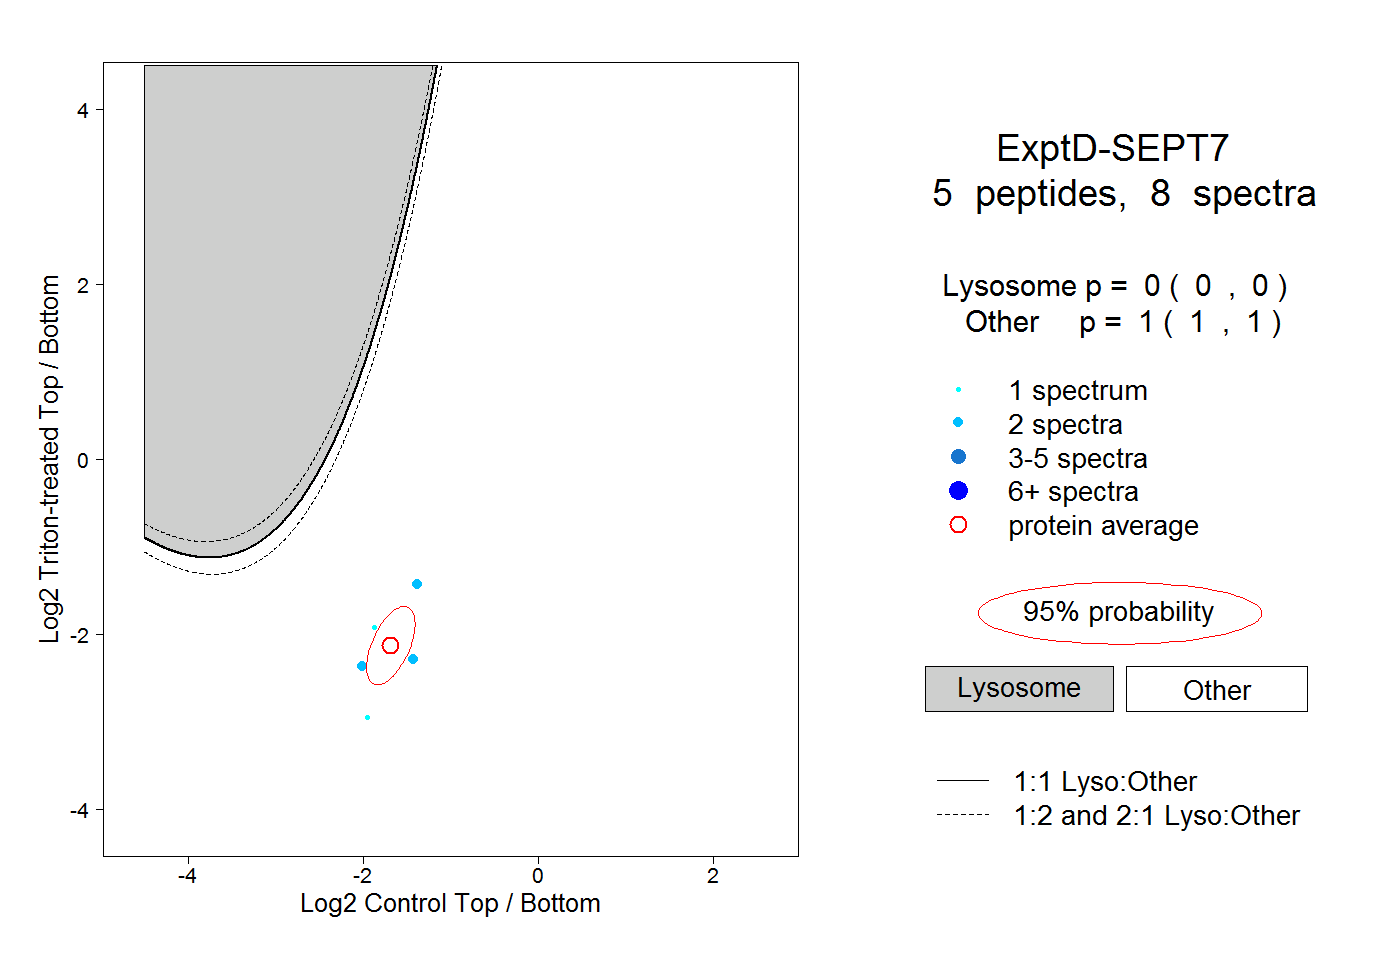
0.000 | 0.000
1.000 | 1.000