 3
3peptides
spectra
0.000 | 0.000
0.000 | 0.031
0.767 | 0.826
0.000 | 0.051
0.000 | 0.027
0.000 | 0.000
0.148 | 0.186
0.000 | 0.000
14peptides
spectra
0.000 | 0.993
0.007 | 1.000
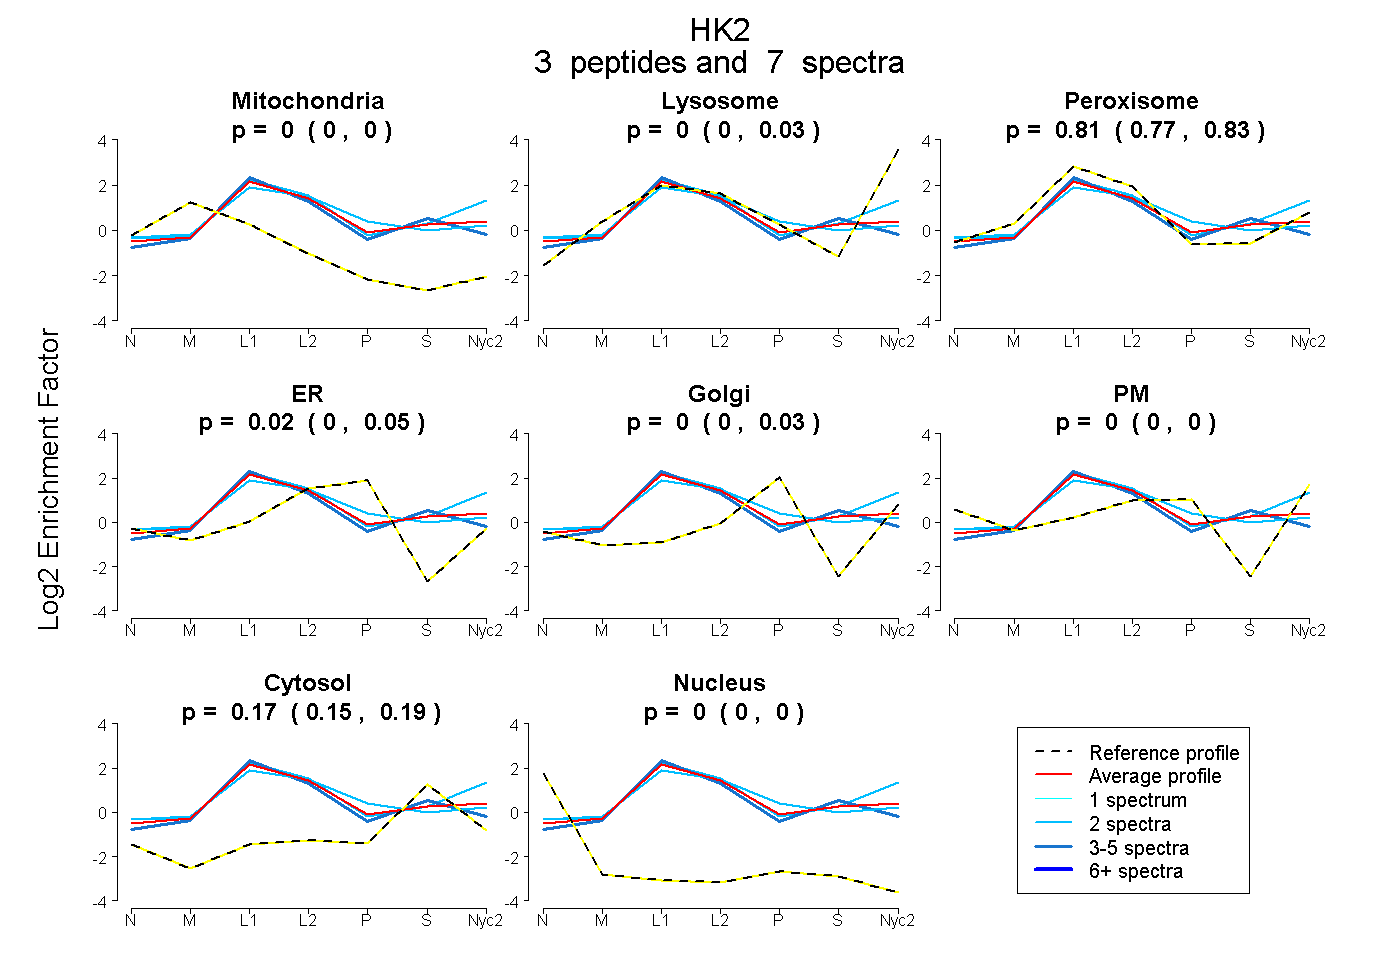
| Plot | Mito | Lyso | Perox | ER | Golgi | PM | Cytosol | Nucleus | |||||
| Expt A |
3 peptides |
7 spectra |
|
0.000 0.000 | 0.000 |
0.000 0.000 | 0.031 |
0.806 0.767 | 0.826 |
0.022 0.000 | 0.051 |
0.000 0.000 | 0.027 |
0.000 0.000 | 0.000 |
0.172 0.148 | 0.186 |
0.000 0.000 | 0.000 |
||
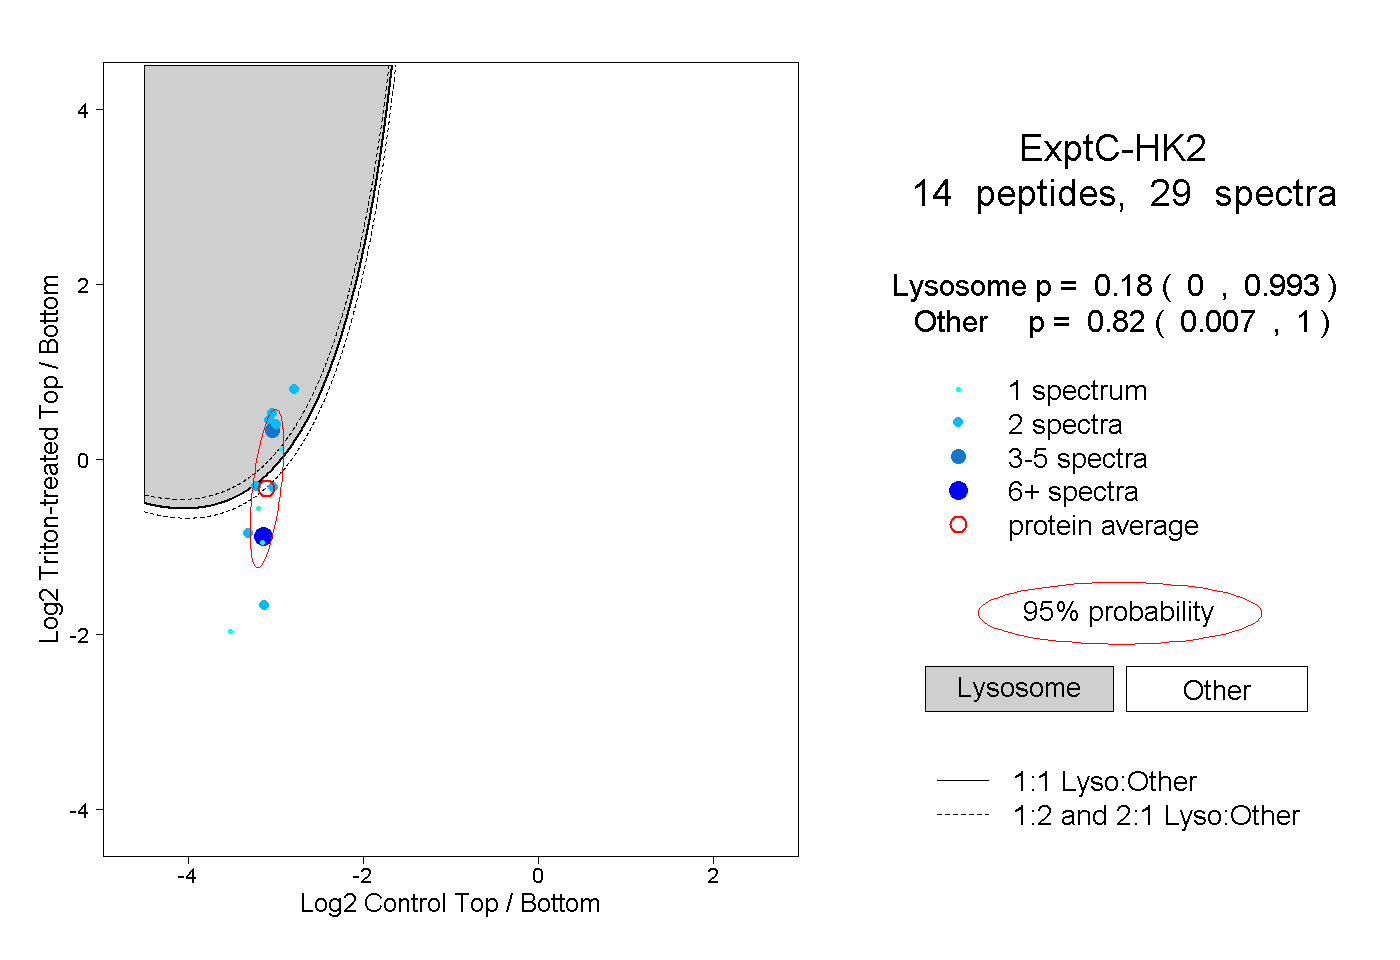
| Plot | Lyso | Other | |||||||||||
| Expt C |
14 peptides |
29 spectra |
|
0.180 0.000 | 0.993 |
0.820 0.007 | 1.000 |
| 1 spectrum, GVEMHNK | 0.042 | 0.958 | ||||||||
| 1 spectrum, EVCTVVAR | 0.001 | 0.999 | ||||||||
| 2 spectra, DVVDLLR | 0.997 | 0.003 | ||||||||
| 3 spectra, NVELVDGEEGR | 0.985 | 0.015 | ||||||||
| 2 spectra, LSHEQLLEVK | 0.000 | 1.000 | ||||||||
| 6 spectra, ETHAVAPVK | 0.001 | 0.999 | ||||||||
| 2 spectra, LHPHFAK | 0.994 | 0.006 | ||||||||
| 2 spectra, STIGVDGSVYK | 0.988 | 0.012 | ||||||||
| 1 spectrum, AELLFQGK | 0.726 | 0.274 | ||||||||
| 2 spectra, VTDNGLQR | 0.005 | 0.995 | ||||||||
| 2 spectra, GAALITAVACR | 0.431 | 0.569 | ||||||||
| 1 spectrum, VDQFLYHMR | 0.000 | 1.000 | ||||||||
| 2 spectra, LADQHR | 0.998 | 0.002 | ||||||||
| 2 spectra, LVPDCDVR | 0.114 | 0.886 |