 7
7peptides
spectra

0.000 | 0.000
0.000 | 0.020
0.061 | 0.143
0.033 | 0.147
0.000 | 0.107
0.340 | 0.449
0.329 | 0.381
0.000 | 0.000
6peptides
spectra
0.000 | 0.000
1.000 | 1.000
| Plot | Mito | Lyso | Perox | ER | Golgi | PM | Cytosol | Nucleus | |||||
| Expt A |
7 peptides |
11 spectra |
|
0.000 0.000 | 0.000 |
0.000 0.000 | 0.020 |
0.102 0.061 | 0.143 |
0.101 0.033 | 0.147 |
0.025 0.000 | 0.107 |
0.411 0.340 | 0.449 |
0.361 0.329 | 0.381 |
0.000 0.000 | 0.000 |
||
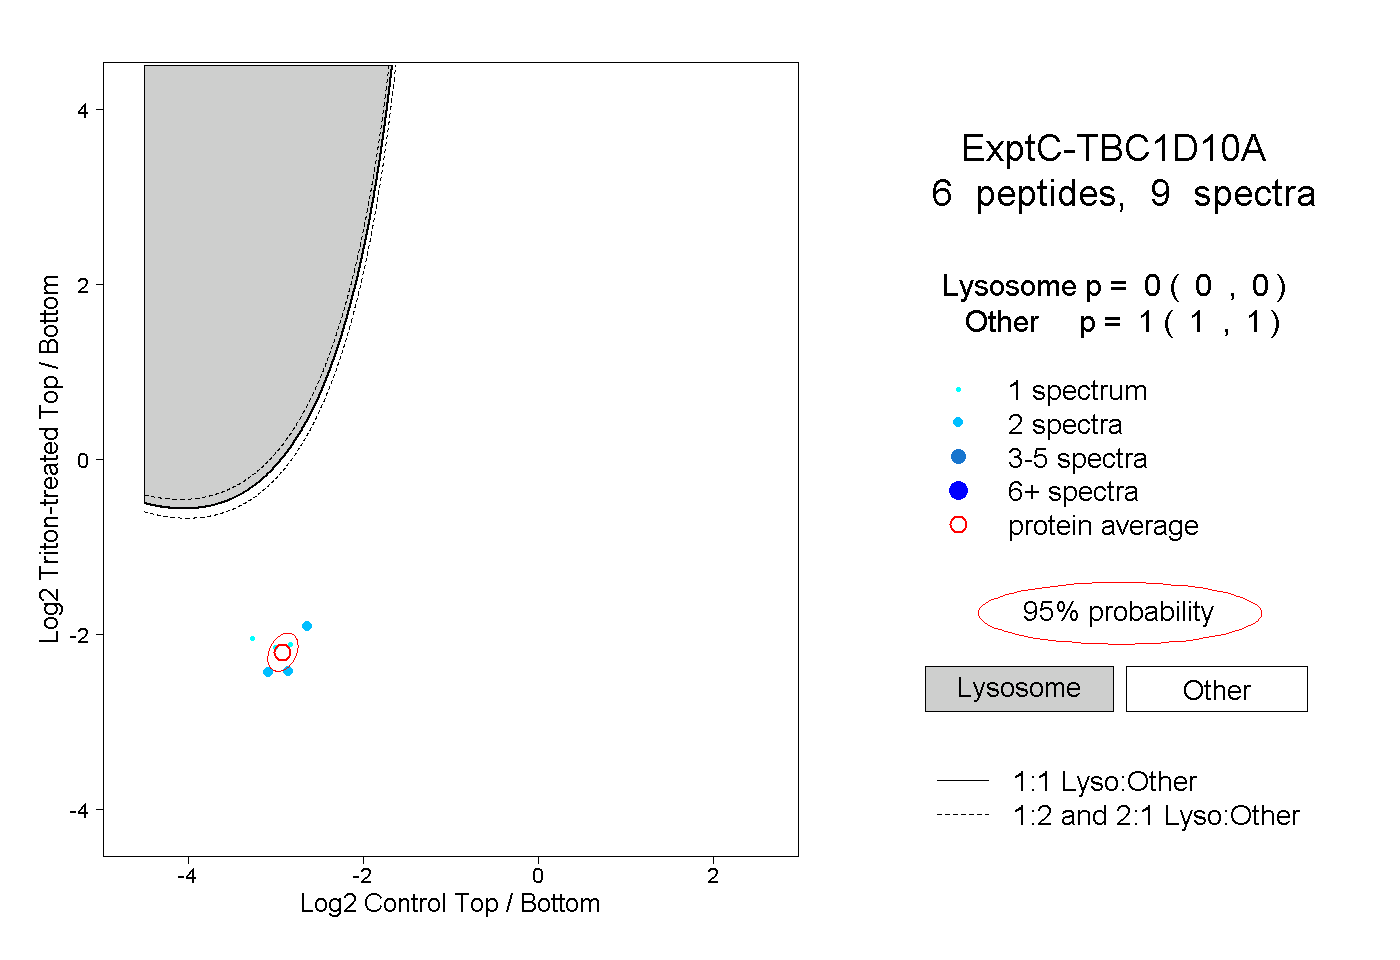
| Plot | Lyso | Other | |||||||||||
| Expt C |
6 peptides |
9 spectra |
|
0.000 0.000 | 0.000 |
1.000 1.000 | 1.000 |