 5
5peptides
spectra
0.000 | 0.000
0.000 | 0.000
0.000 | 0.000
0.001 | 0.270
0.060 | 0.367
0.000 | 0.000
0.189 | 0.232
0.380 | 0.451
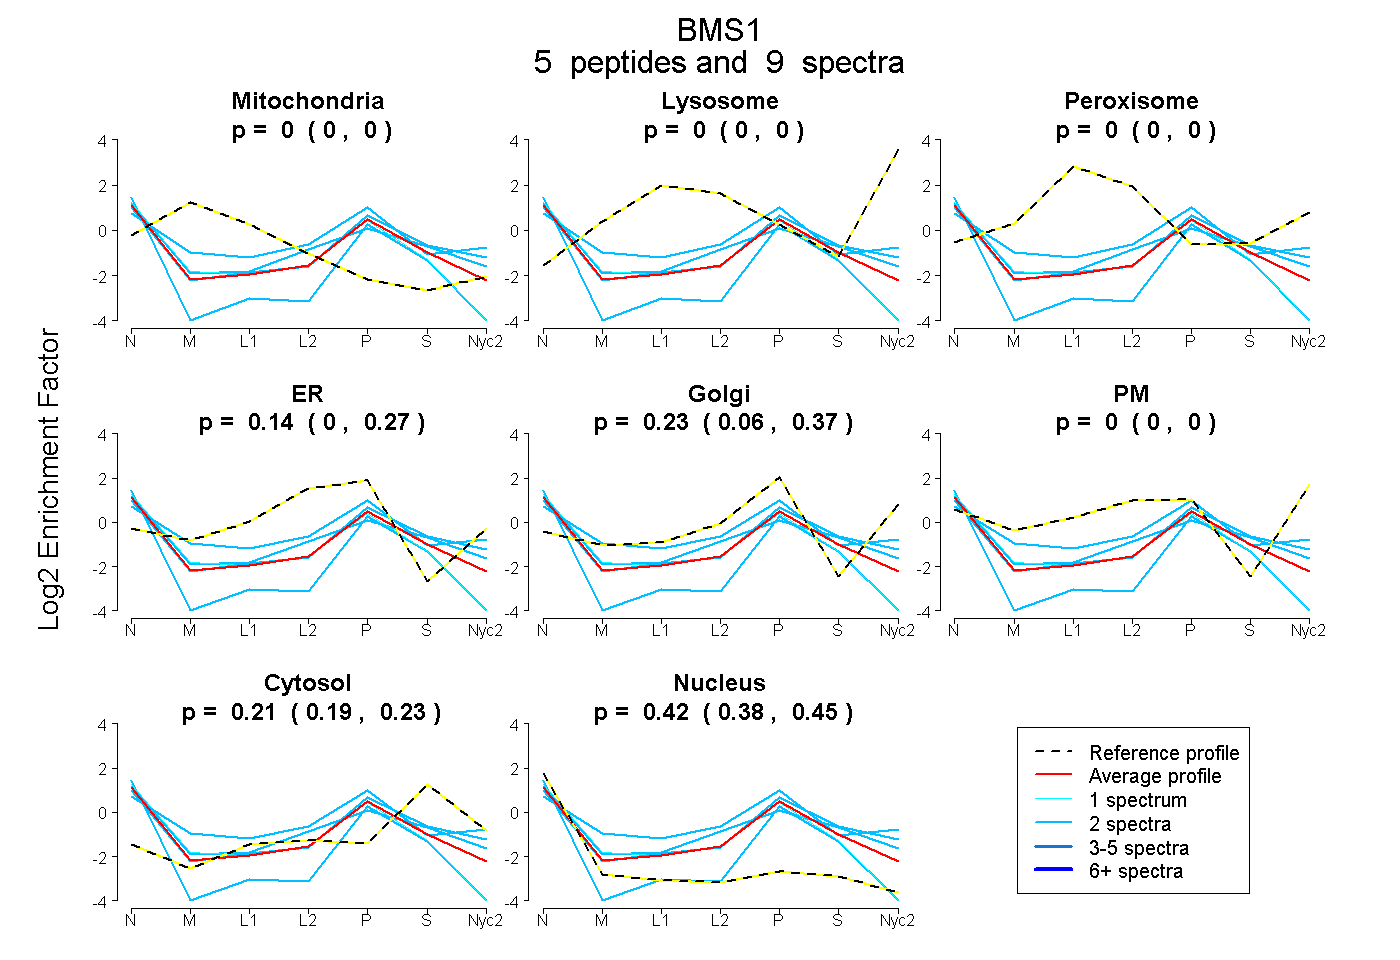
| Plot | Mito | Lyso | Perox | ER | Golgi | PM | Cytosol | Nucleus | |||||
| Expt A |
5 peptides |
9 spectra |
|
0.000 0.000 | 0.000 |
0.000 0.000 | 0.000 |
0.000 0.000 | 0.000 |
0.144 0.001 | 0.270 |
0.225 0.060 | 0.367 |
0.000 0.000 | 0.000 |
0.212 0.189 | 0.232 |
0.419 0.380 | 0.451 |
| 2 spectra, QRPAVIR | 0.000 | 0.000 | 0.000 | 0.000 | 0.426 | 0.000 | 0.280 | 0.294 | ||
| 1 spectrum, MEDLTNPEDIR | 0.000 | 0.000 | 0.000 | 0.329 | 0.000 | 0.000 | 0.093 | 0.578 | ||
| 2 spectra, VQYEGFRPGMYVR | 0.000 | 0.000 | 0.000 | 0.172 | 0.354 | 0.102 | 0.194 | 0.178 | ||
| 2 spectra, HLQDLQLGDEEDAR | 0.000 | 0.000 | 0.000 | 0.263 | 0.067 | 0.044 | 0.297 | 0.329 | ||
| 2 spectra, DTGEASSVGGAR | 0.000 | 0.000 | 0.000 | 0.000 | 0.091 | 0.000 | 0.154 | 0.756 |