 2
2peptides
spectra
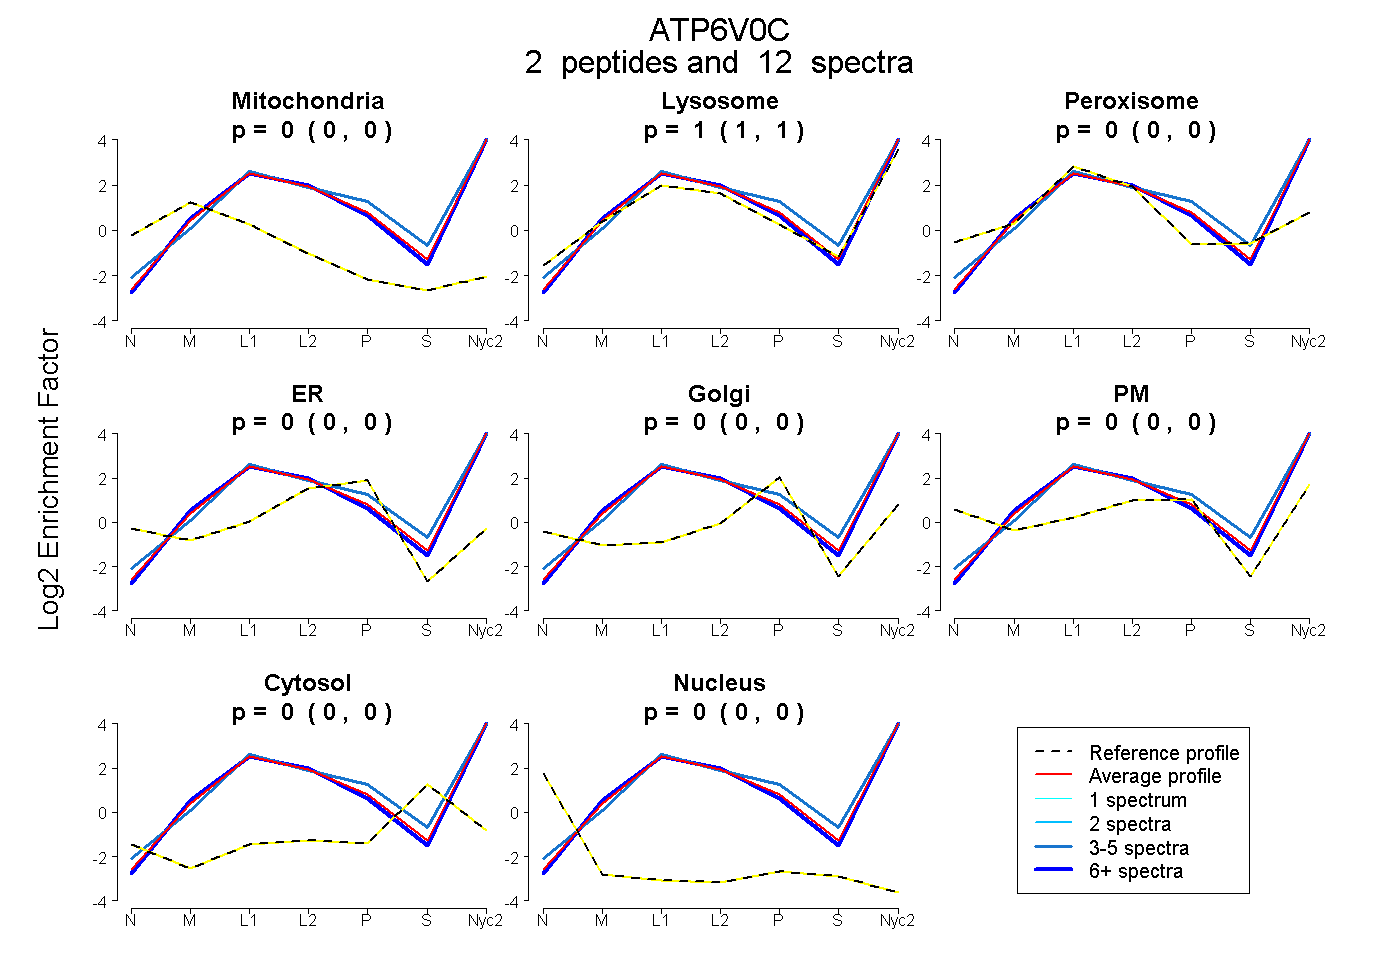
0.000 | 0.000
1.000 | 1.000
0.000 | 0.000
0.000 | 0.000
0.000 | 0.000
0.000 | 0.000
0.000 | 0.000
0.000 | 0.000
2peptides
spectra
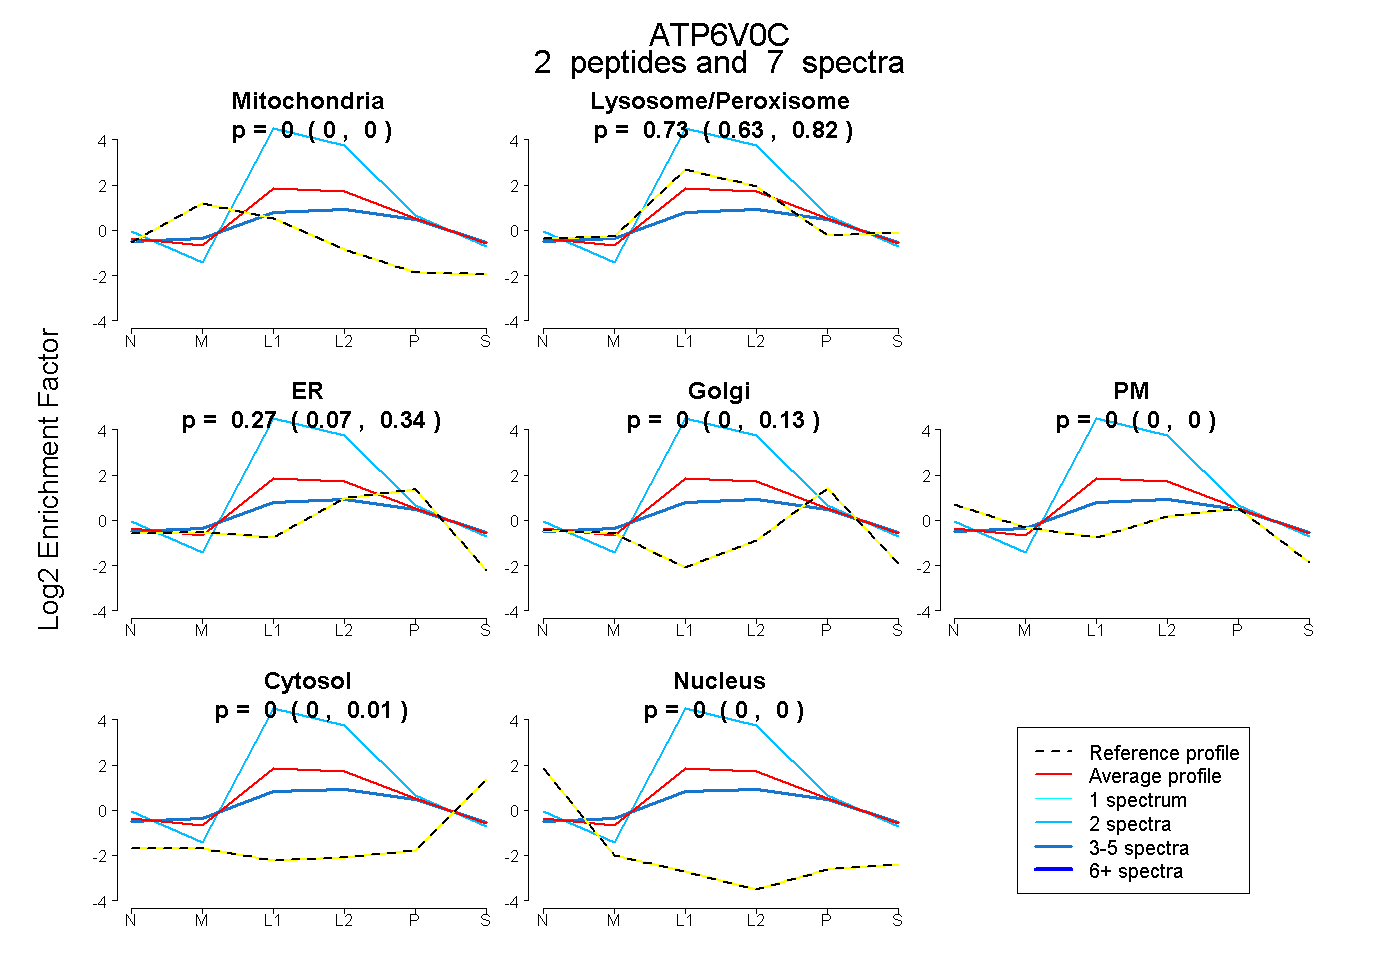
0.000 | 0.000
0.632 | 0.821
0.067 | 0.341
0.000 | 0.129
0.000 | 0.000
0.000 | 0.012
0.000 | 0.000
1peptide
spectra
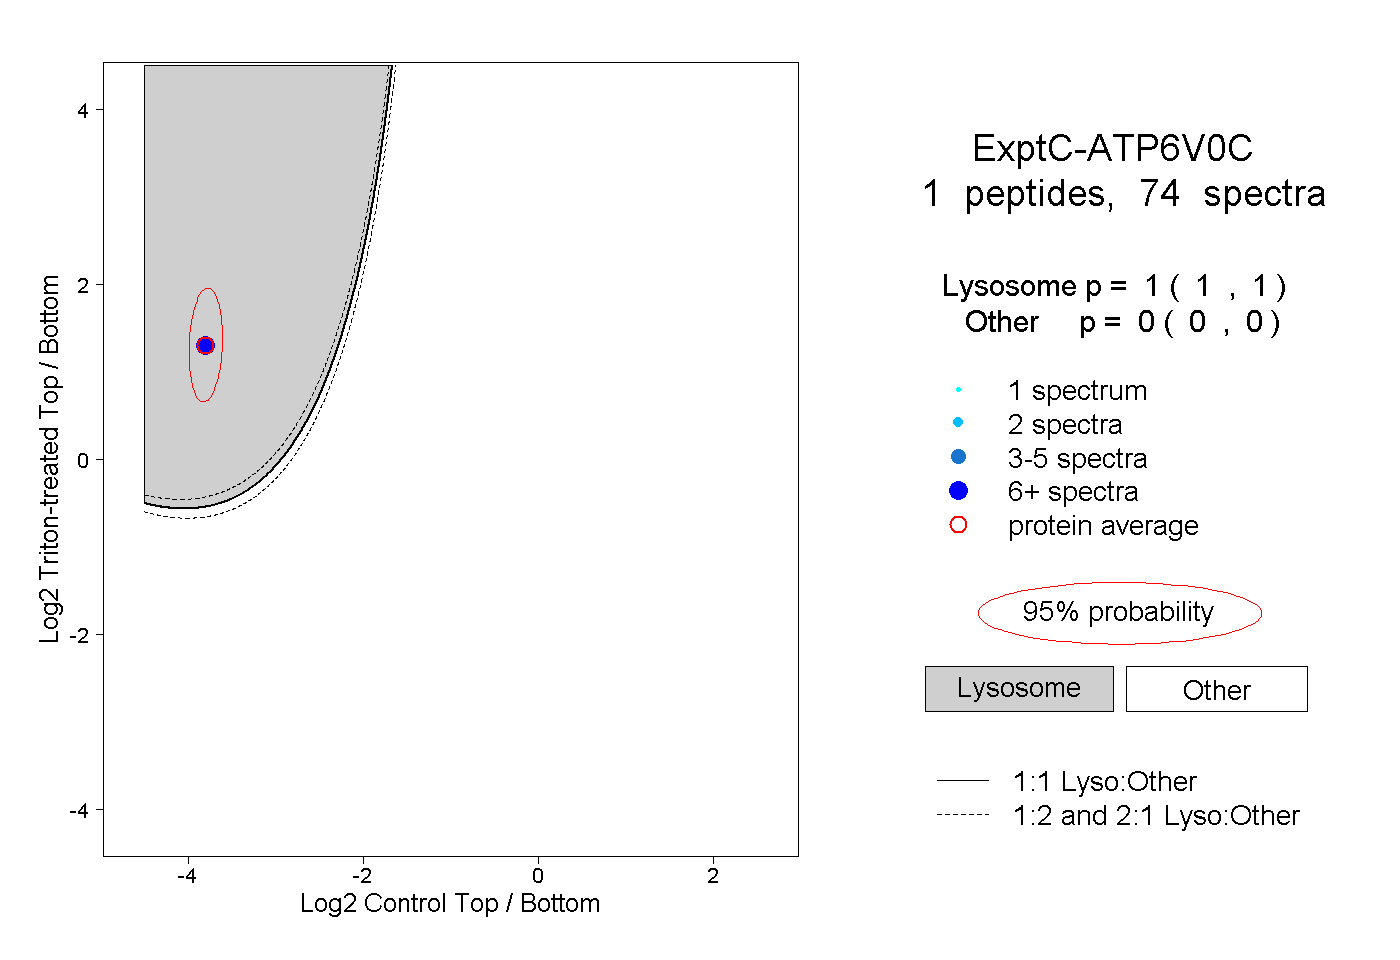
1.000 | 1.000
0.000 | 0.000
1peptide
spectrum
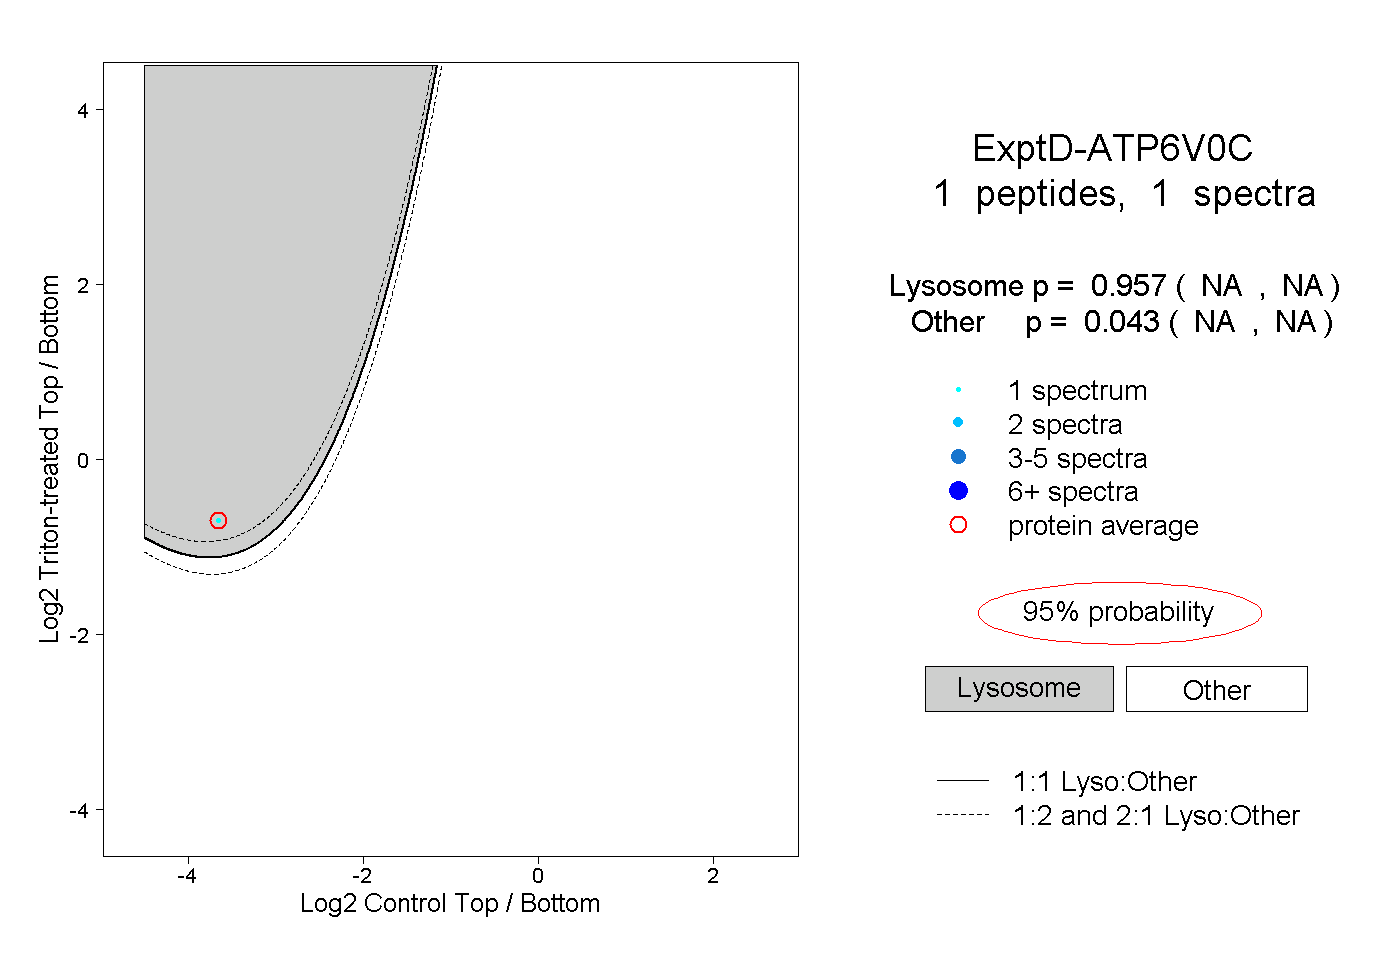
NA | NA
NA | NA