 4
4peptides
spectra
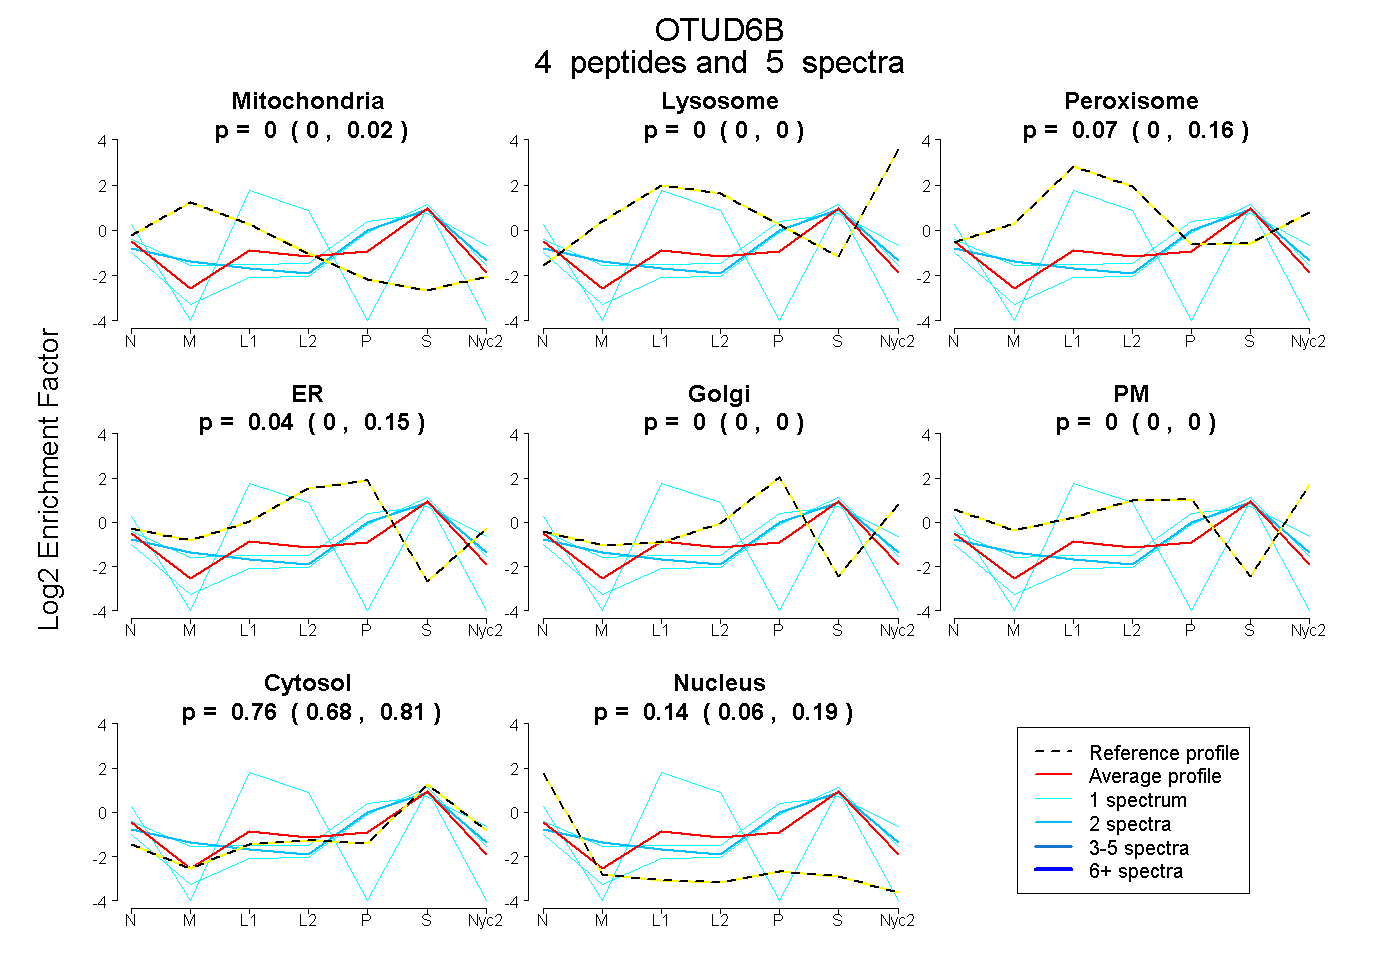
0.000 | 0.021
0.000 | 0.000
0.000 | 0.157
0.000 | 0.153
0.000 | 0.000
0.000 | 0.000
0.677 | 0.812
0.057 | 0.189
| Plot | Mito | Lyso | Perox | ER | Golgi | PM | Cytosol | Nucleus | |||||
| Expt A |
4 peptides |
5 spectra |
|
0.000 0.000 | 0.021 |
0.000 0.000 | 0.000 |
0.067 0.000 | 0.157 |
0.037 0.000 | 0.153 |
0.000 0.000 | 0.000 |
0.000 0.000 | 0.000 |
0.760 0.677 | 0.812 |
0.135 0.057 | 0.189 |
| 2 spectra, NPLVLVYMR | 0.031 | 0.000 | 0.000 | 0.000 | 0.170 | 0.000 | 0.734 | 0.065 | ||
| 1 spectrum, EQDSALTVATLR | 0.000 | 0.000 | 0.000 | 0.000 | 0.033 | 0.000 | 0.858 | 0.109 | ||
| 1 spectrum, IAEAEIENLSGAR | 0.000 | 0.000 | 0.317 | 0.000 | 0.000 | 0.000 | 0.394 | 0.289 | ||
| 1 spectrum, LAQILAAR | 0.000 | 0.000 | 0.000 | 0.000 | 0.317 | 0.000 | 0.661 | 0.022 |
| Plot | Mito | Lyso or Perox | ER | Golgi | PM | Cytosol | Nucleus | ||||||
| Expt B |
1 peptide |
2 spectra |
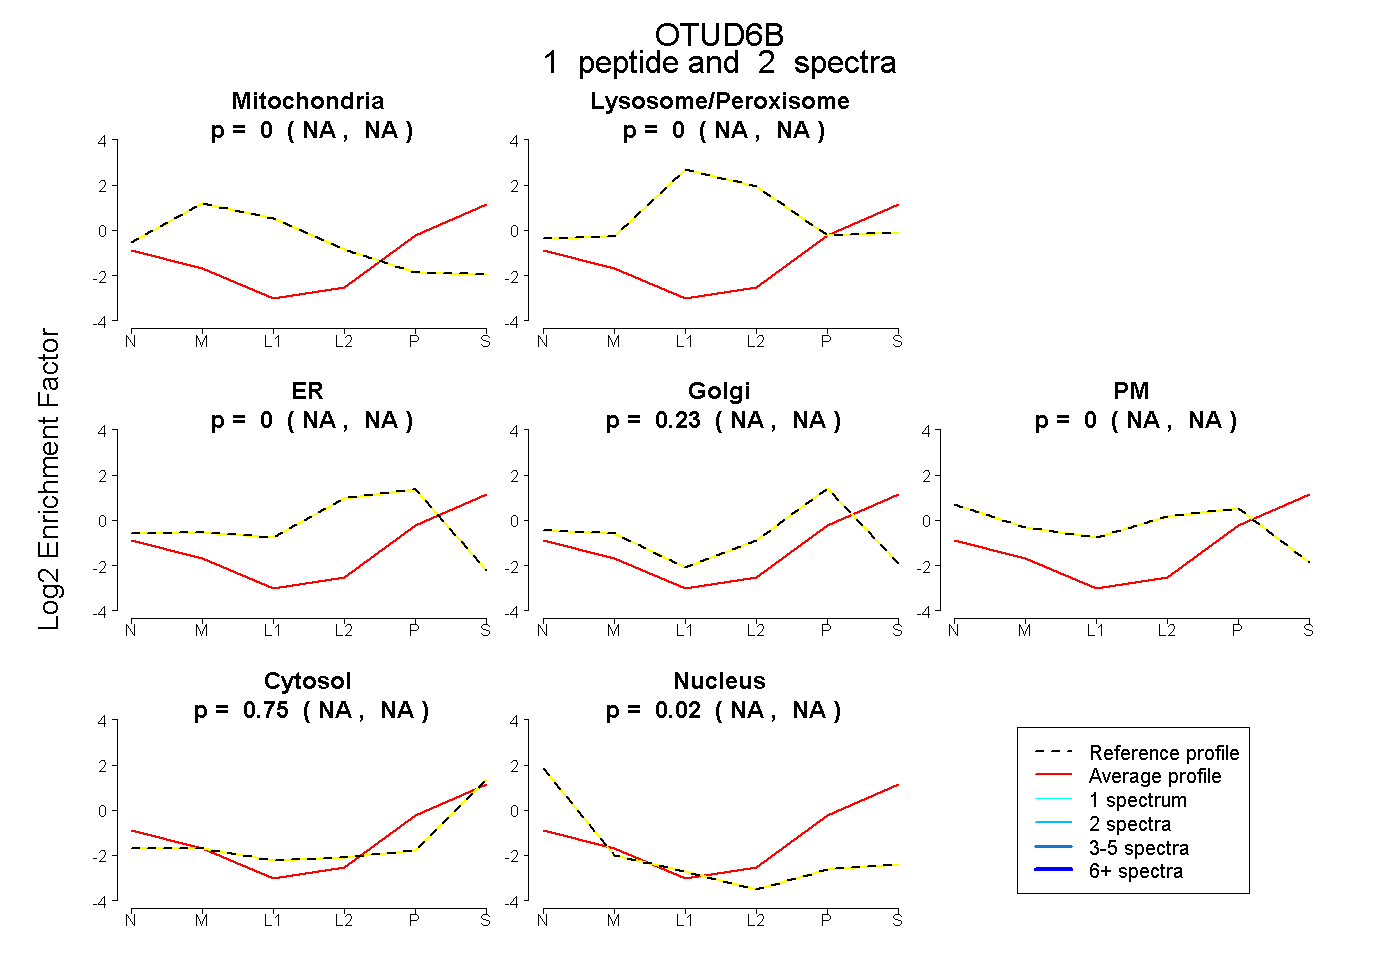 |
0.000 NA | NA |
0.000 NA | NA |
0.000 NA | NA |
0.228 NA | NA |
0.000 NA | NA |
0.750 NA | NA |
0.022 NA | NA |