 15
15peptides
spectra
0.000 | 0.000
0.000 | 0.015
0.000 | 0.000
0.000 | 0.000
0.000 | 0.000
0.000 | 0.000
0.984 | 0.999
0.000 | 0.000
| Plot | Mito | Lyso | Perox | ER | Golgi | PM | Cytosol | Nucleus | |||||
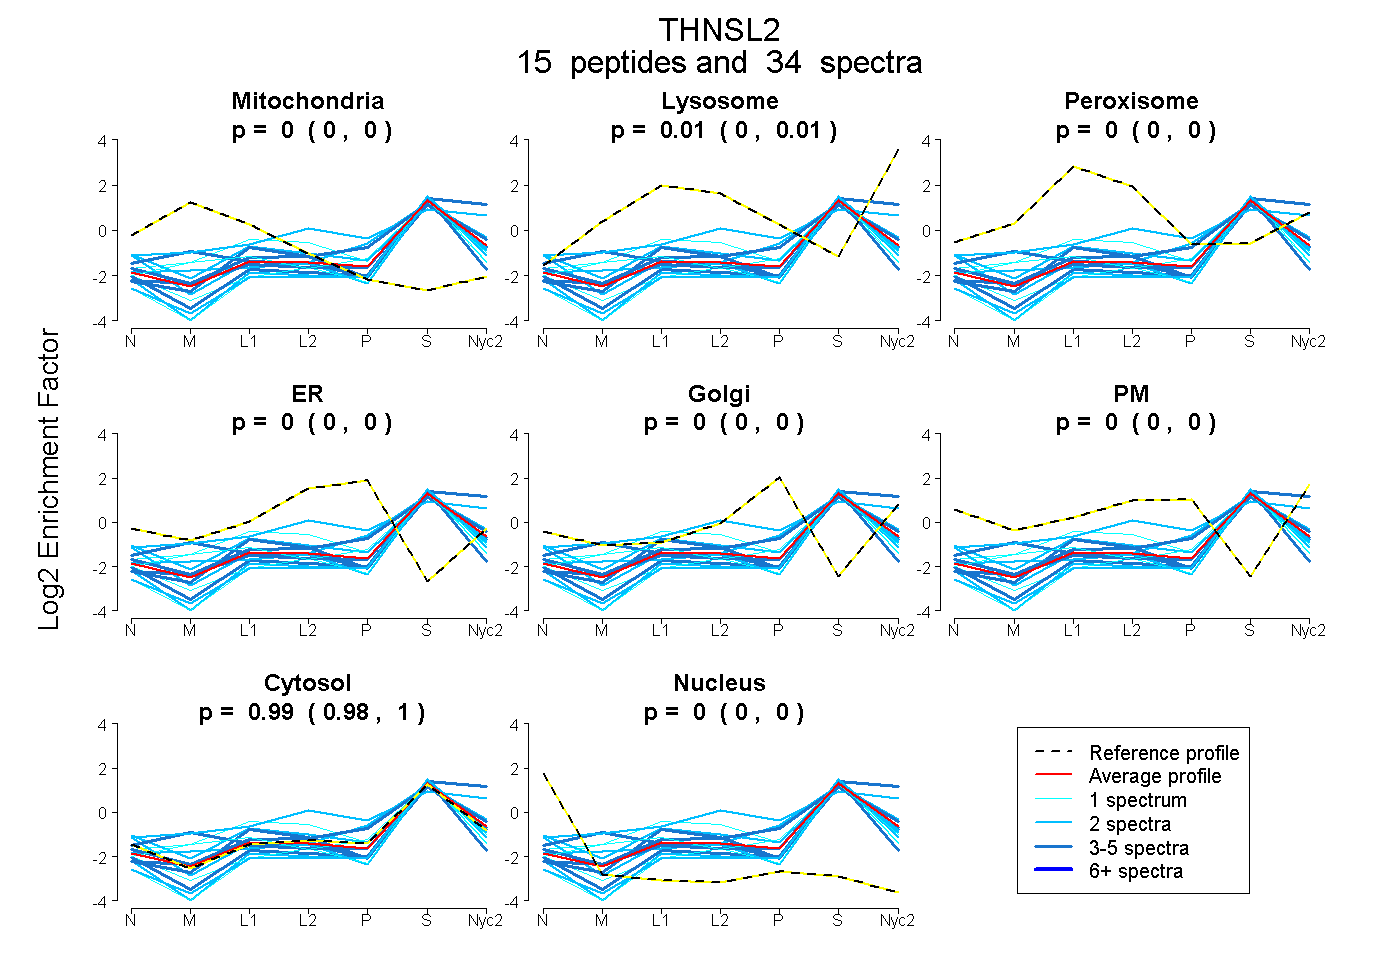
| Expt A |
15 peptides |
34 spectra |
|
0.000 0.000 | 0.000 |
0.008 0.000 | 0.015 |
0.000 0.000 | 0.000 |
0.000 0.000 | 0.000 |
0.000 0.000 | 0.000 |
0.000 0.000 | 0.000 |
0.992 0.984 | 0.999 |
0.000 0.000 | 0.000 |
| 4 spectra, HDLNGLIDQAFSR | 0.193 | 0.000 | 0.000 | 0.000 | 0.000 | 0.000 | 0.807 | 0.000 | ||
| 1 spectrum, CCLAPASAVK | 0.000 | 0.000 | 0.000 | 0.000 | 0.000 | 0.000 | 0.940 | 0.060 | ||
| 2 spectra, IQELQMTTVVK | 0.072 | 0.000 | 0.000 | 0.000 | 0.000 | 0.000 | 0.928 | 0.000 | ||
| 4 spectra, GDFSLCEVVR | 0.000 | 0.168 | 0.000 | 0.000 | 0.000 | 0.000 | 0.832 | 0.000 | ||
| 1 spectrum, AVFADVAFVQR | 0.000 | 0.033 | 0.207 | 0.000 | 0.000 | 0.000 | 0.760 | 0.000 | ||
| 2 spectra, GCVENTAE | 0.000 | 0.028 | 0.118 | 0.000 | 0.000 | 0.000 | 0.854 | 0.000 | ||
| 2 spectra, HNLMSLNSINWSR | 0.000 | 0.304 | 0.016 | 0.010 | 0.000 | 0.045 | 0.625 | 0.000 | ||
| 4 spectra, MWYTSTR | 0.000 | 0.000 | 0.000 | 0.000 | 0.000 | 0.000 | 1.000 | 0.000 | ||
| 3 spectra, DVVHLCK | 0.000 | 0.000 | 0.000 | 0.000 | 0.000 | 0.000 | 0.944 | 0.056 | ||
| 3 spectra, MGLPISLVVAVNR | 0.000 | 0.053 | 0.000 | 0.000 | 0.054 | 0.000 | 0.893 | 0.000 | ||
| 2 spectra, TLASAMDIQVPYNMER | 0.000 | 0.000 | 0.000 | 0.000 | 0.000 | 0.000 | 1.000 | 0.000 | ||
| 1 spectrum, NDIIHR | 0.106 | 0.010 | 0.000 | 0.000 | 0.000 | 0.000 | 0.884 | 0.000 | ||
| 1 spectrum, LSEAVTSESVSDEAITQTMGR | 0.000 | 0.000 | 0.000 | 0.000 | 0.000 | 0.000 | 0.998 | 0.002 | ||
| 2 spectra, ALMEQFER | 0.000 | 0.000 | 0.000 | 0.000 | 0.000 | 0.000 | 0.982 | 0.018 | ||
| 2 spectra, DTIEALSLR | 0.000 | 0.000 | 0.000 | 0.000 | 0.078 | 0.000 | 0.919 | 0.003 |
| Plot | Mito | Lyso or Perox | ER | Golgi | PM | Cytosol | Nucleus | ||||||
| Expt B |
5 peptides |
9 spectra |
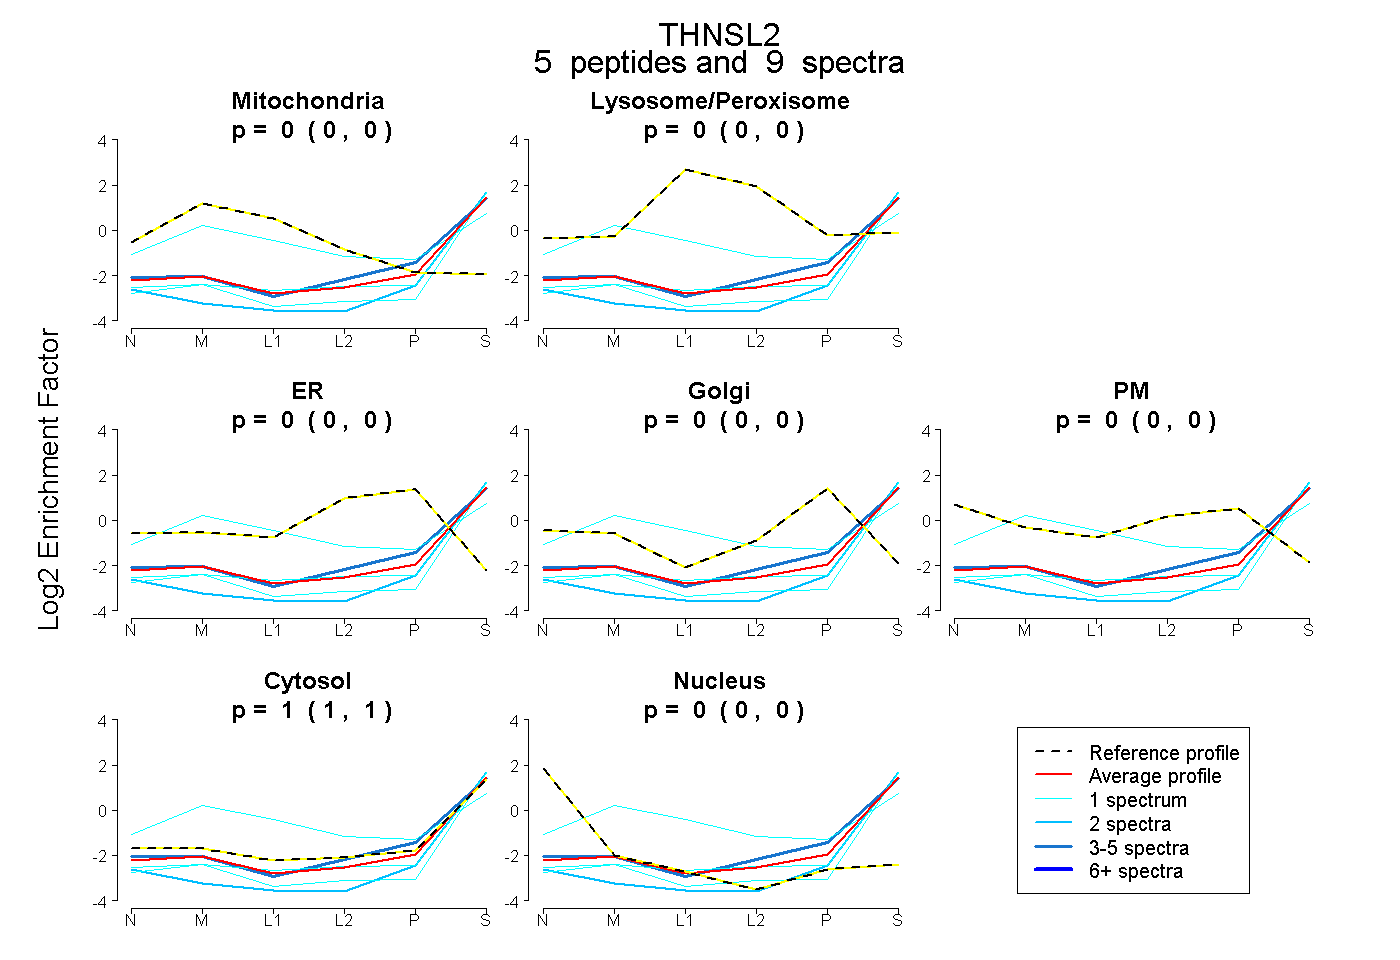 |
0.000 0.000 | 0.000 |
0.000 0.000 | 0.000 |
0.000 0.000 | 0.000 |
0.000 0.000 | 0.000 |
0.000 0.000 | 0.000 |
1.000 1.000 | 1.000 |
0.000 0.000 | 0.000 |
|||
| Plot | Lyso | Other | |||||||||||
| Expt C |
11 peptides |
25 spectra |
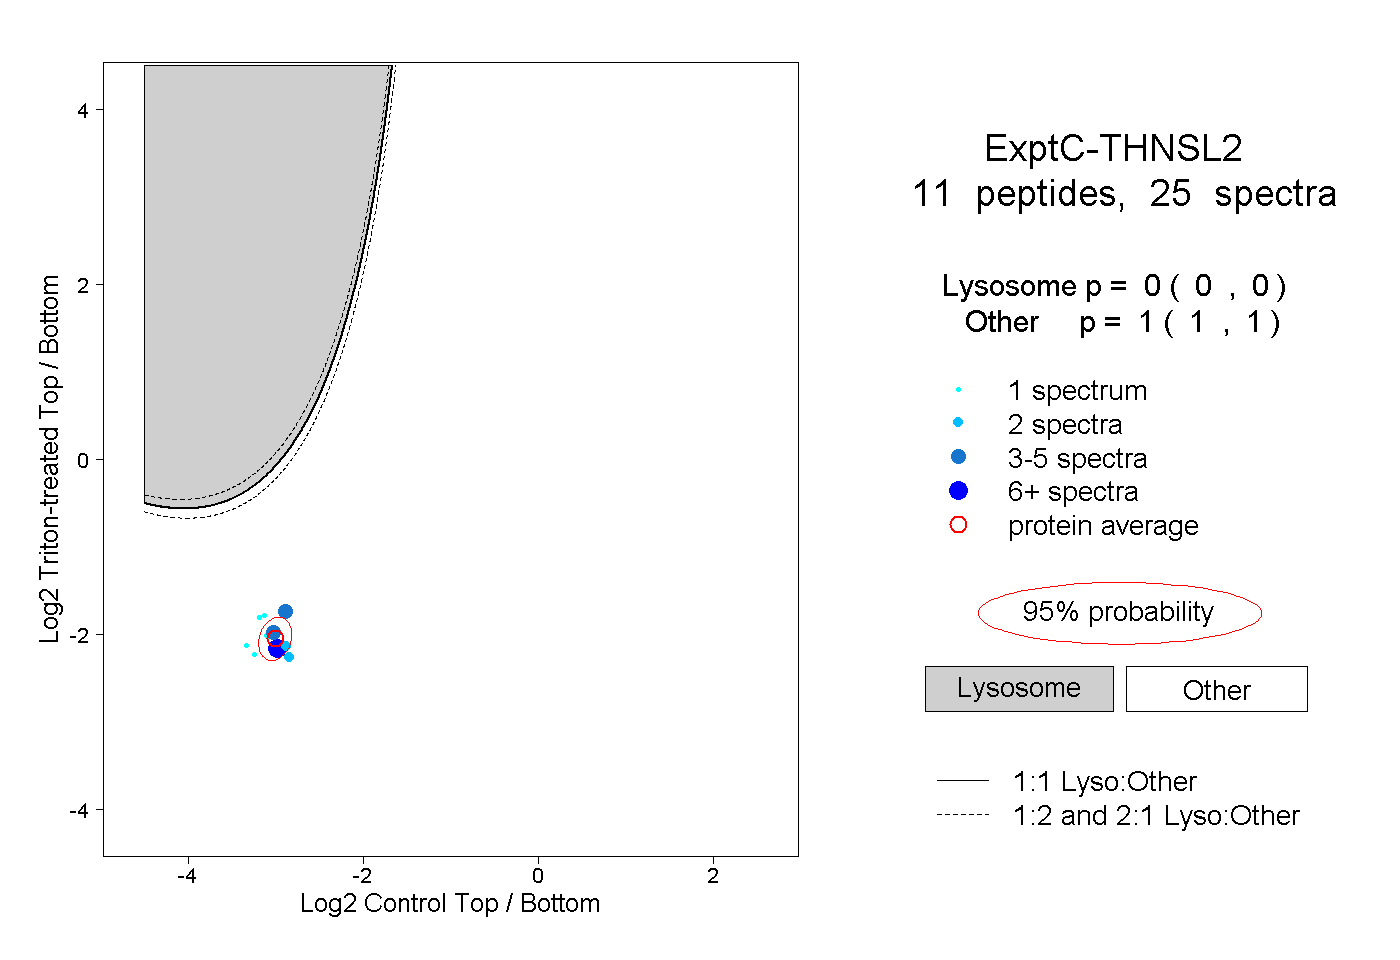 |
0.000 0.000 | 0.000 |
1.000 1.000 | 1.000 |
||||||||
| Plot | Lyso | Other | |||||||||||
| Expt D |
2 peptides |
2 spectra |
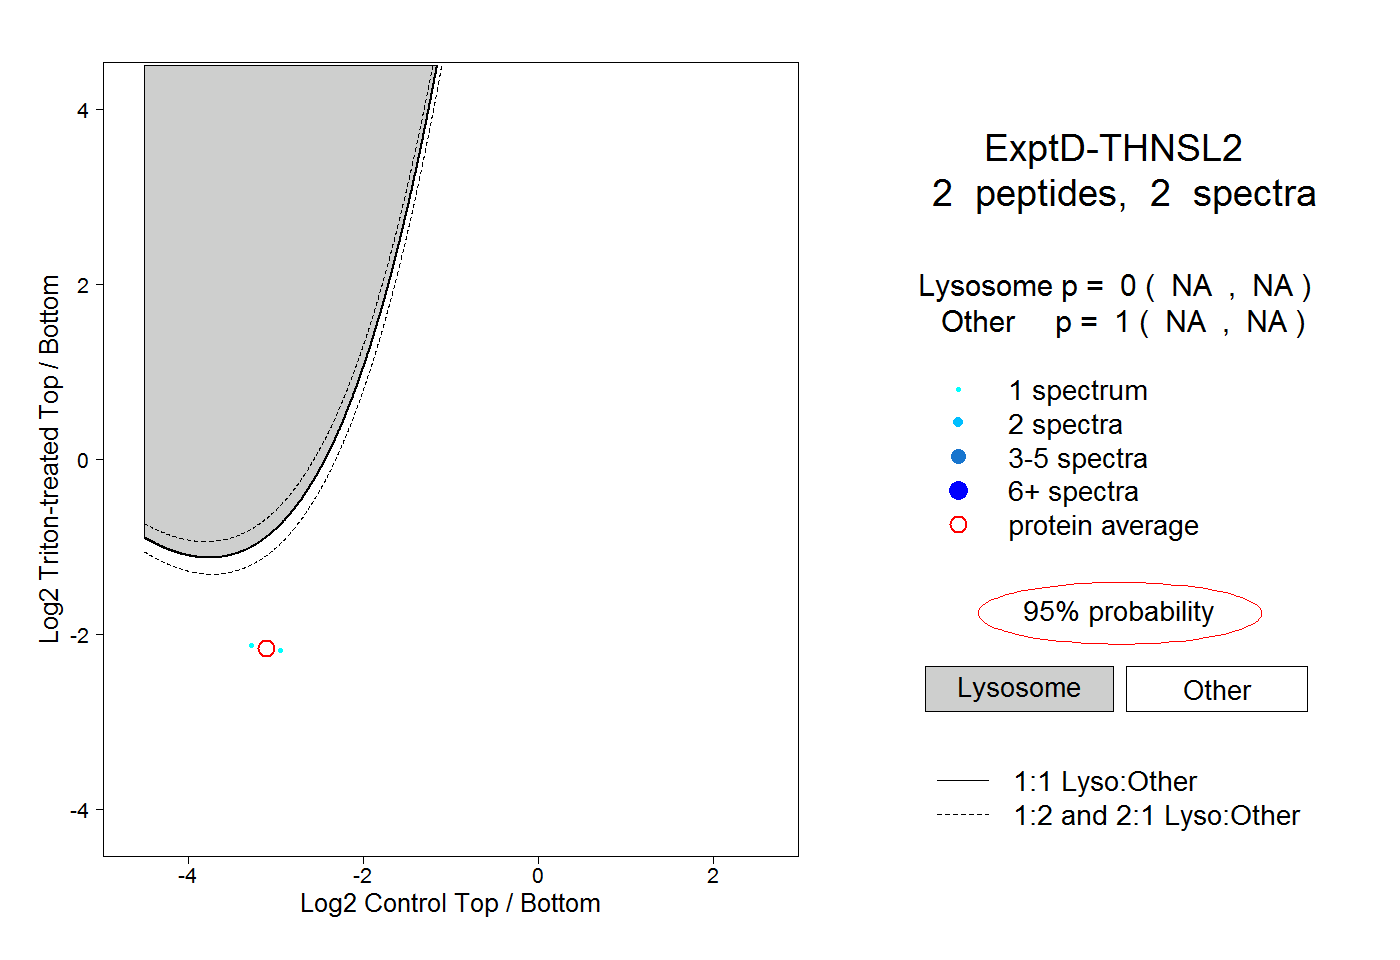 |
0.000 NA | NA |
1.000 NA | NA |