 2
2peptides
spectra
0.562 | 0.669
0.068 | 0.144
0.000 | 0.102
0.000 | 0.000
0.000 | 0.043
0.107 | 0.230
0.000 | 0.098
0.000 | 0.000
| Plot | Mito | Lyso | Perox | ER | Golgi | PM | Cytosol | Nucleus | |||||
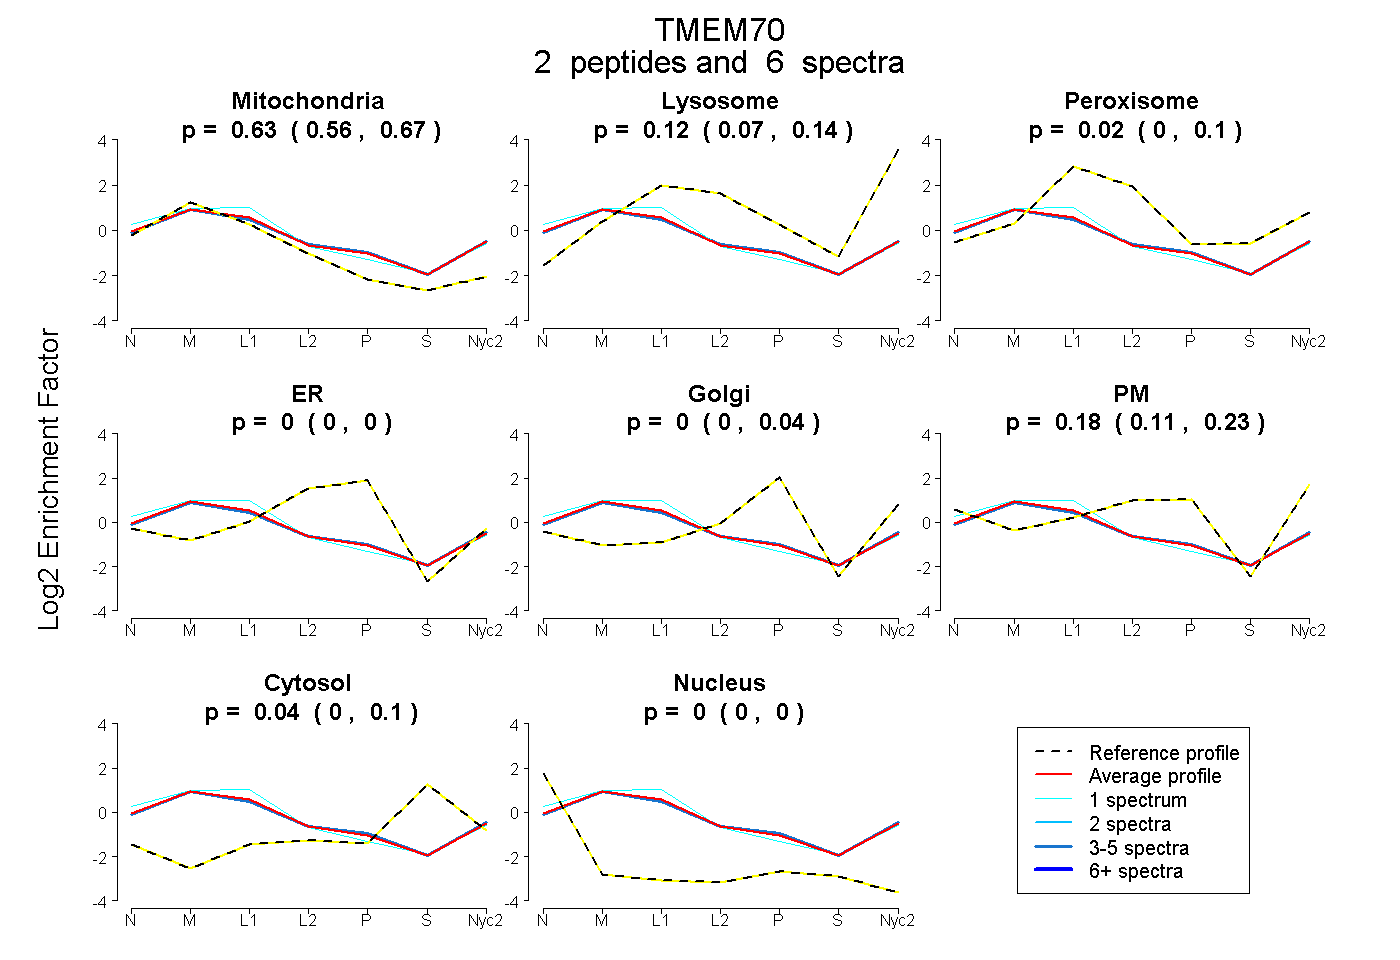
| Expt A |
2 peptides |
6 spectra |
|
0.632 0.562 | 0.669 |
0.118 0.068 | 0.144 |
0.024 0.000 | 0.102 |
0.000 0.000 | 0.000 |
0.000 0.000 | 0.043 |
0.184 0.107 | 0.230 |
0.042 0.000 | 0.098 |
0.000 0.000 | 0.000 |
| 1 spectrum, LYHEATTDTYR | 0.629 | 0.037 | 0.188 | 0.000 | 0.000 | 0.134 | 0.000 | 0.013 | ||
| 5 spectra, LIYTGNLAR | 0.630 | 0.136 | 0.000 | 0.000 | 0.021 | 0.169 | 0.044 | 0.000 |
| Plot | Mito | Lyso or Perox | ER | Golgi | PM | Cytosol | Nucleus | ||||||
| Expt B |
1 peptide |
3 spectra |
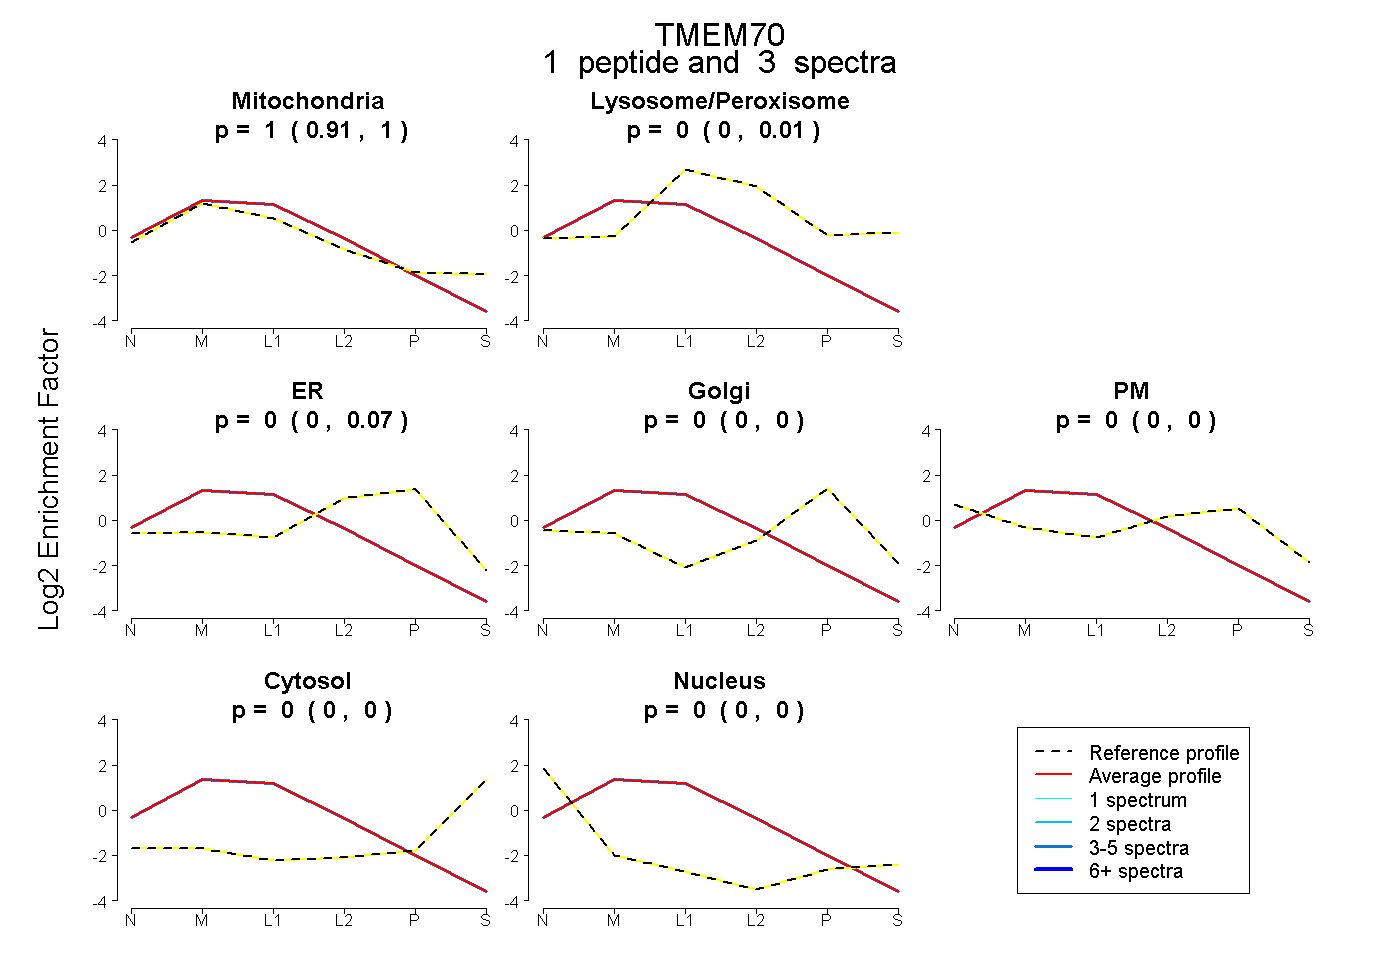 |
1.000 0.915 | 1.000 |
0.000 0.000 | 0.008 |
0.000 0.000 | 0.069 |
0.000 0.000 | 0.000 |
0.000 0.000 | 0.000 |
0.000 0.000 | 0.000 |
0.000 0.000 | 0.000 |
|||
| Plot | Lyso | Other | |||||||||||
| Expt C |
4 peptides |
21 spectra |
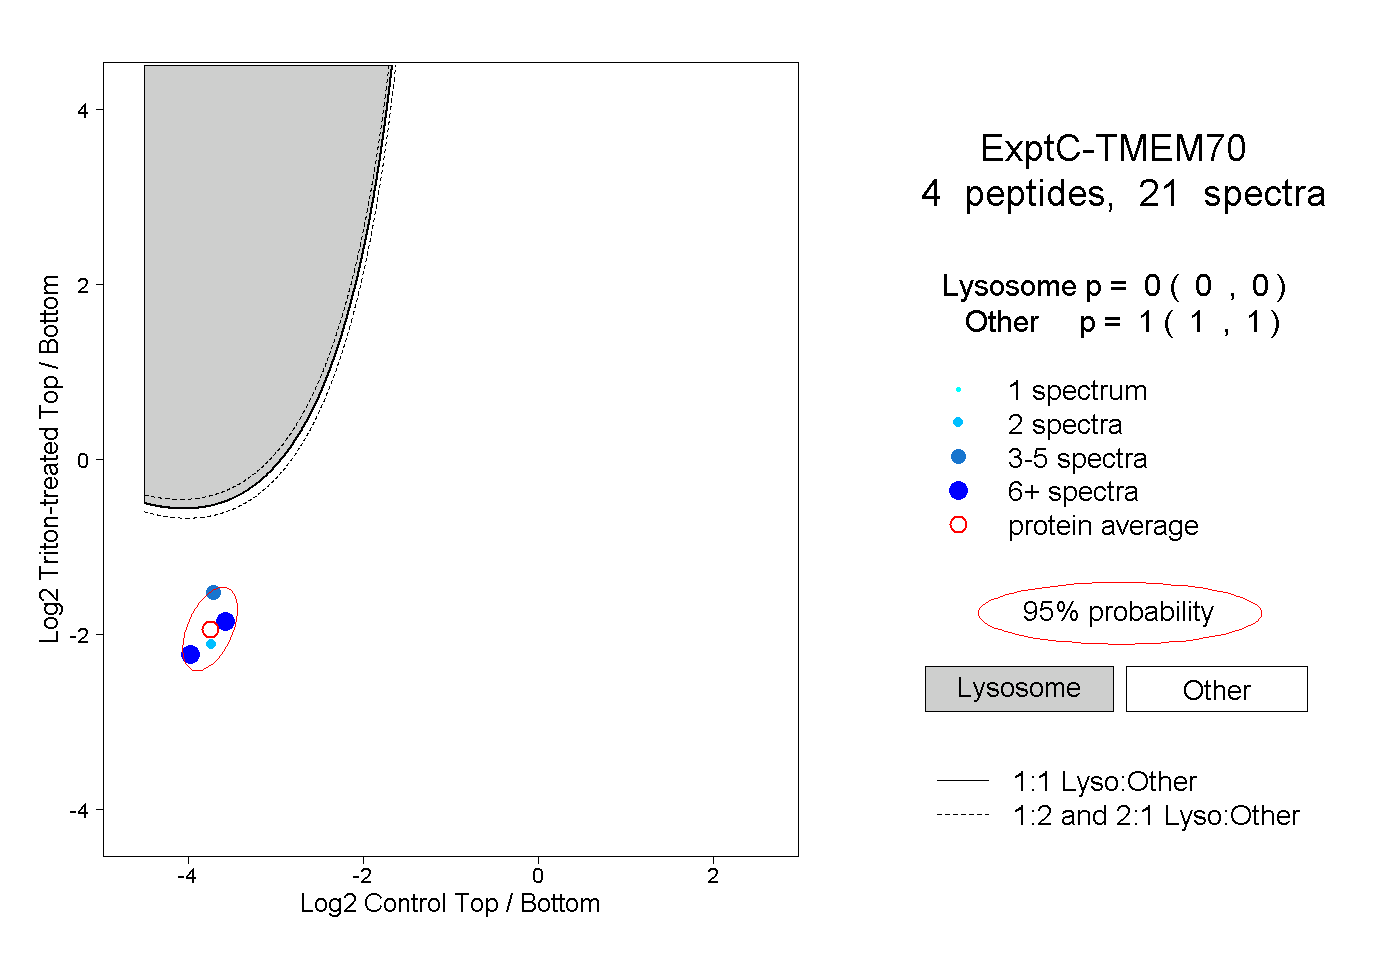 |
0.000 0.000 | 0.000 |
1.000 1.000 | 1.000 |
||||||||
| Plot | Lyso | Other | |||||||||||
| Expt D |
1 peptide |
2 spectra |
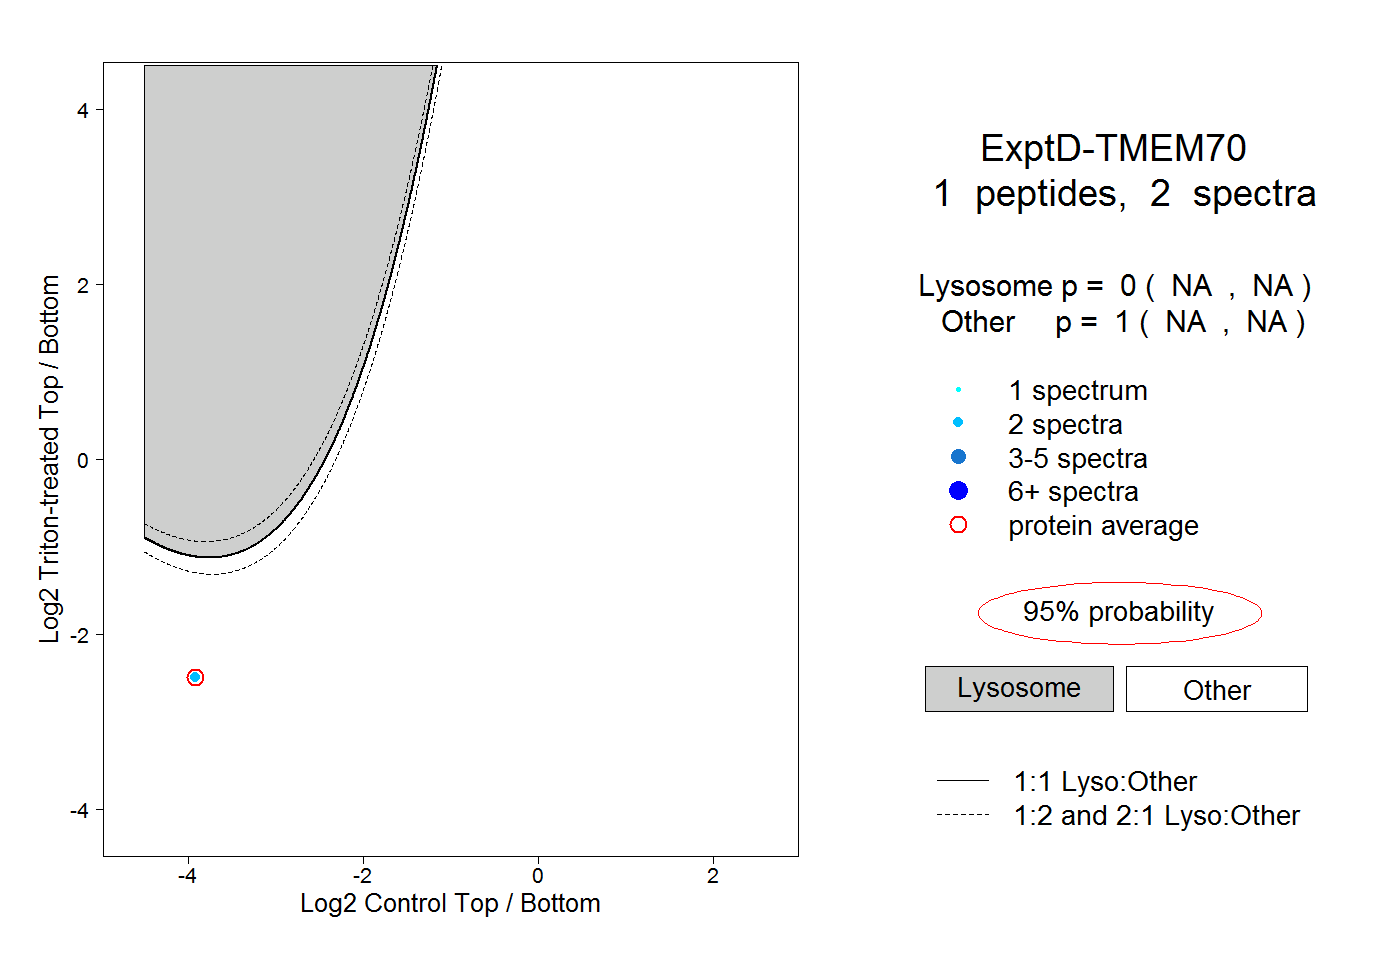 |
0.000 NA | NA |
1.000 NA | NA |