 4
4peptides
spectra
0.000 | 0.000
0.996 | 1.000
0.000 | 0.000
0.000 | 0.000
0.000 | 0.000
0.000 | 0.000
0.000 | 0.000
0.000 | 0.000
7peptides
spectra
1.000 | 1.000
0.000 | 0.000
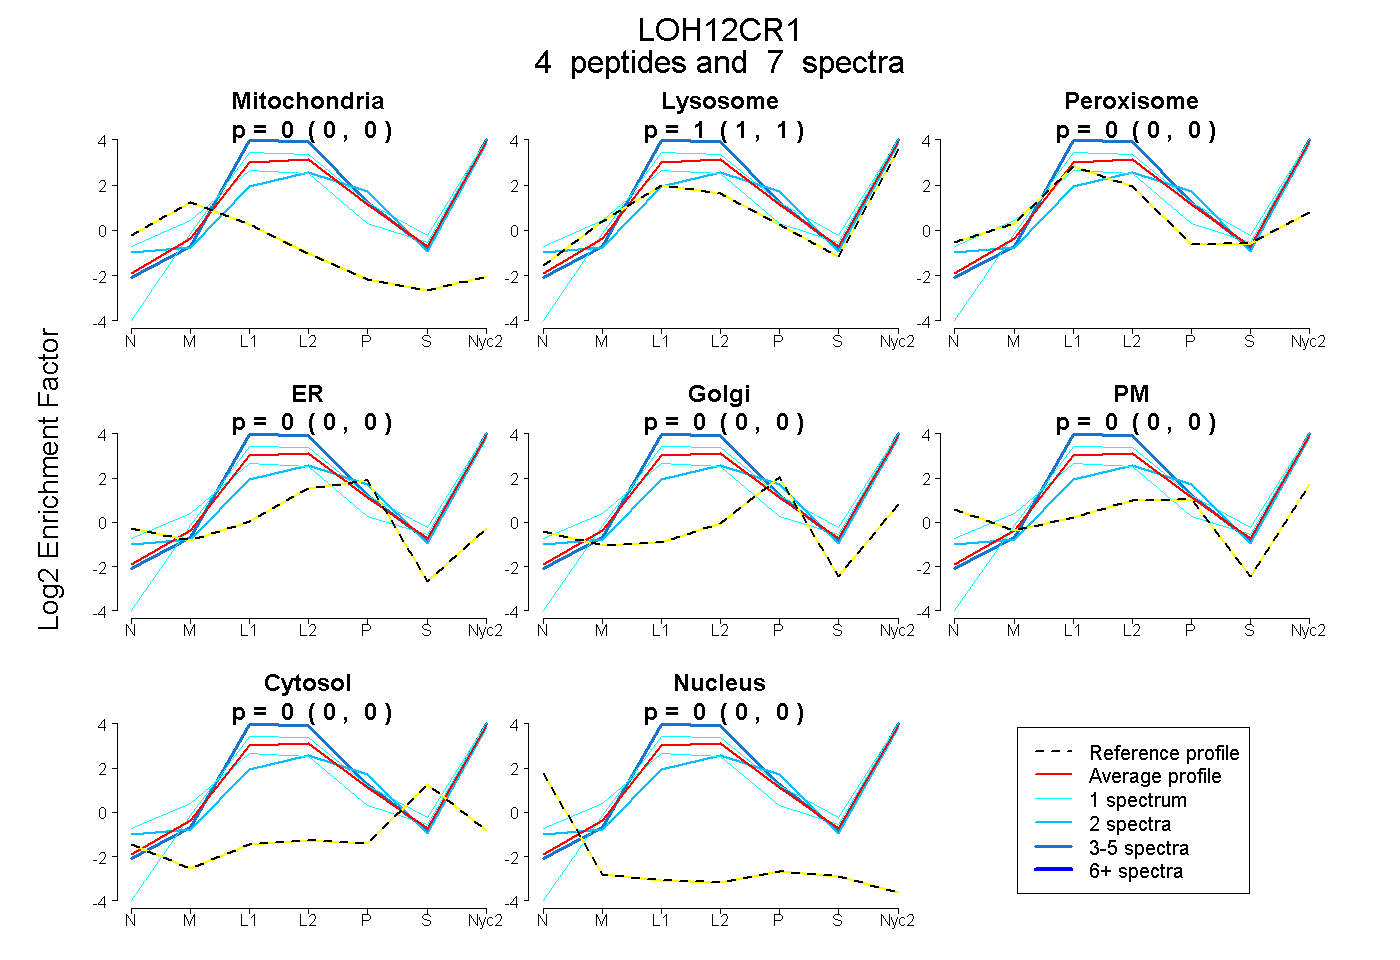
| Plot | Mito | Lyso | Perox | ER | Golgi | PM | Cytosol | Nucleus | |||||
| Expt A |
4 peptides |
7 spectra |
|
0.000 0.000 | 0.000 |
1.000 0.996 | 1.000 |
0.000 0.000 | 0.000 |
0.000 0.000 | 0.000 |
0.000 0.000 | 0.000 |
0.000 0.000 | 0.000 |
0.000 0.000 | 0.000 |
0.000 0.000 | 0.000 |
||
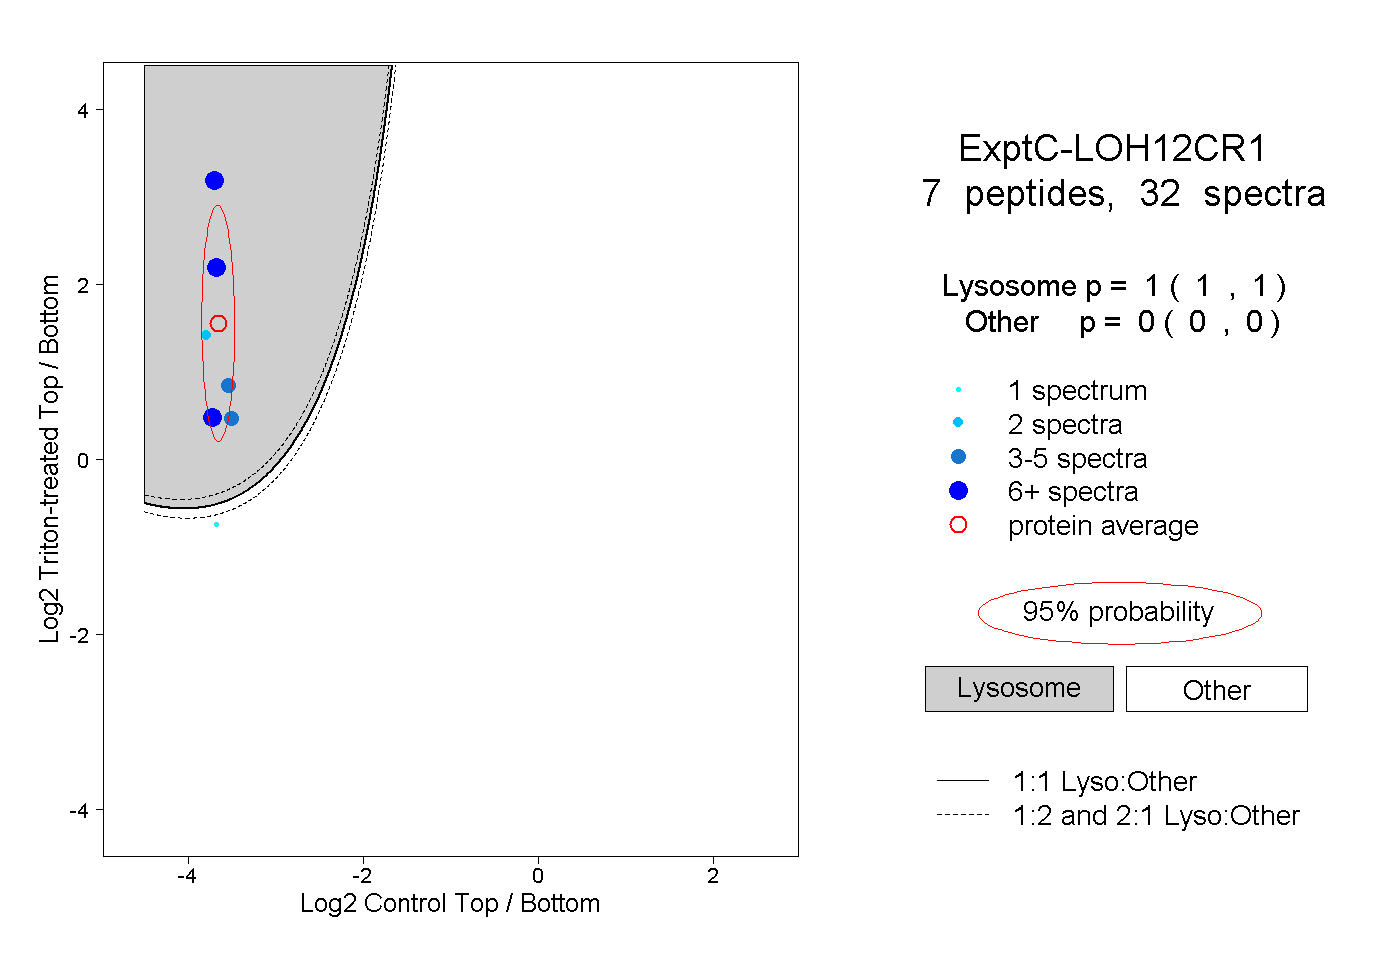
| Plot | Lyso | Other | |||||||||||
| Expt C |
7 peptides |
32 spectra |
|
1.000 1.000 | 1.000 |
0.000 0.000 | 0.000 |
| 1 spectrum, LQEIPTFQPLLK | 0.060 | 0.940 | ||||||||
| 4 spectra, LNSMLPEAER | 1.000 | 0.000 | ||||||||
| 6 spectra, VNEMSAILR | 1.000 | 0.000 | ||||||||
| 2 spectra, LEPFSMRPER | 1.000 | 0.000 | ||||||||
| 6 spectra, NVSNDPDVIK | 1.000 | 0.000 | ||||||||
| 5 spectra, YAEQIQK | 1.000 | 0.000 | ||||||||
| 8 spectra, GLLSGQTSPTNAR | 1.000 | 0.000 |
| Plot | Lyso | Other | |||||||||||
| Expt D |
1 peptide |
1 spectrum |
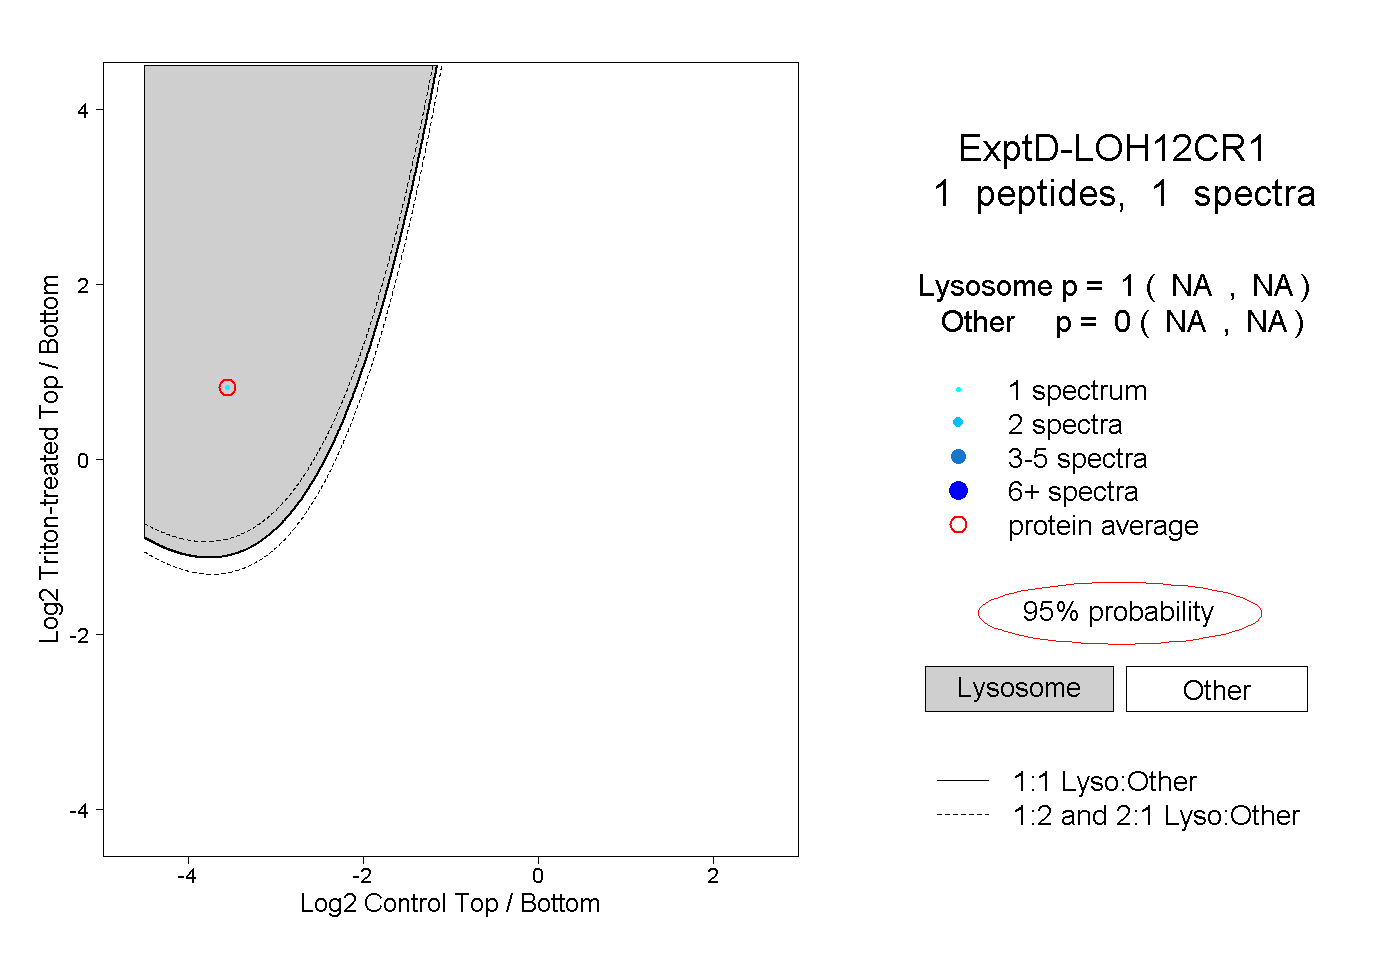 |
1.000 NA | NA |
0.000 NA | NA |