 4
4peptides
spectra
0.000 | 0.000
0.996 | 1.000
0.000 | 0.000
0.000 | 0.000
0.000 | 0.000
0.000 | 0.000
0.000 | 0.000
0.000 | 0.000
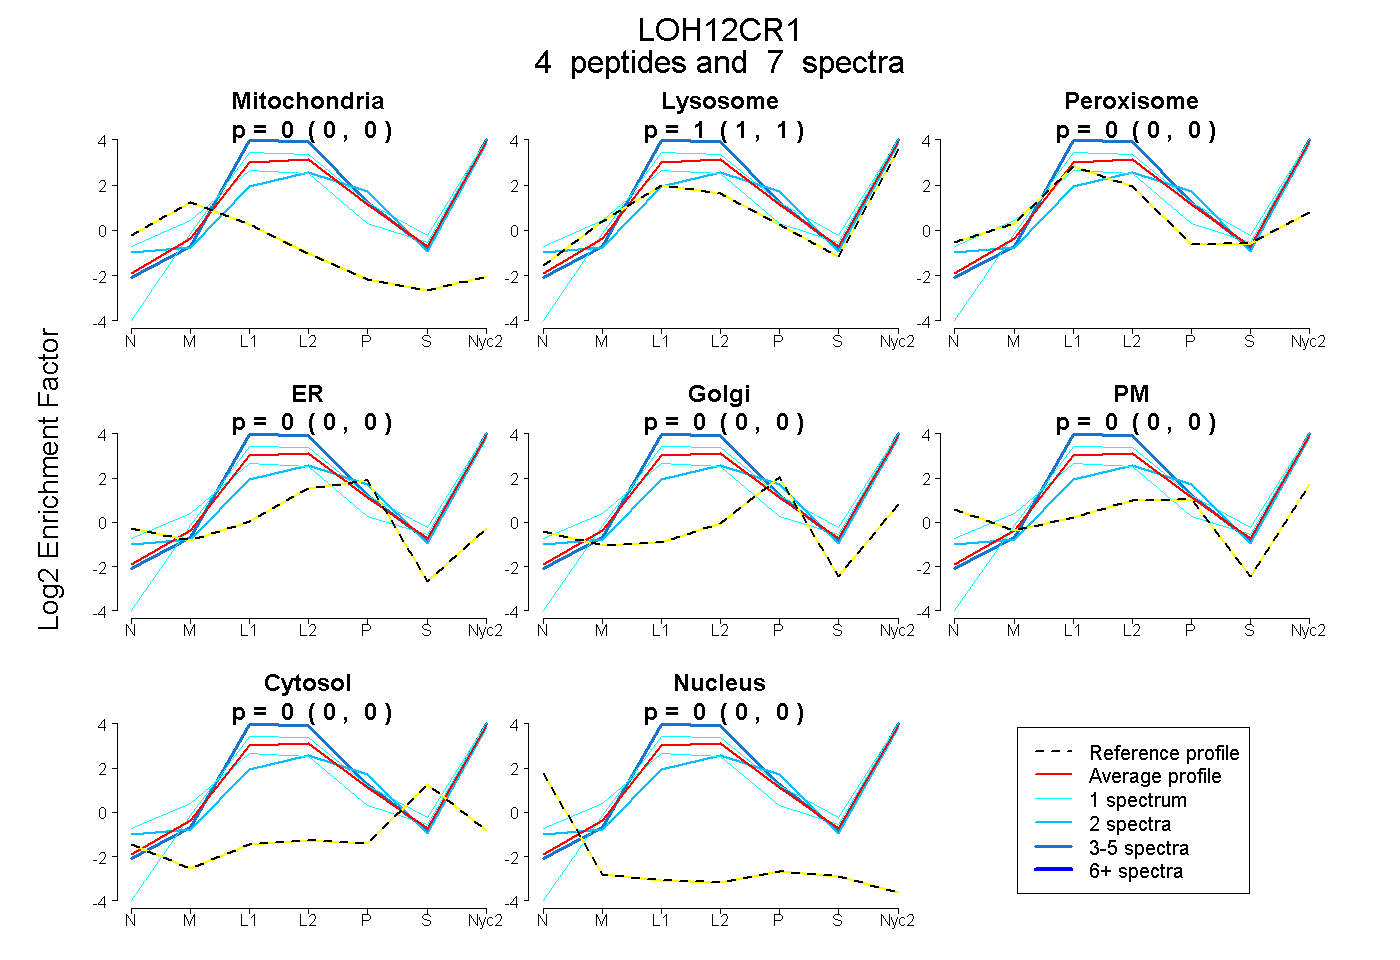
| Plot | Mito | Lyso | Perox | ER | Golgi | PM | Cytosol | Nucleus | |||||
| Expt A |
4 peptides |
7 spectra |
|
0.000 0.000 | 0.000 |
1.000 0.996 | 1.000 |
0.000 0.000 | 0.000 |
0.000 0.000 | 0.000 |
0.000 0.000 | 0.000 |
0.000 0.000 | 0.000 |
0.000 0.000 | 0.000 |
0.000 0.000 | 0.000 |
| 2 spectra, LNSMLPEAER | 0.000 | 0.881 | 0.000 | 0.119 | 0.000 | 0.000 | 0.000 | 0.000 | ||
| 1 spectrum, IQMGIDQTVPLMER | 0.000 | 1.000 | 0.000 | 0.000 | 0.000 | 0.000 | 0.000 | 0.000 | ||
| 1 spectrum, MDDIVVVAQGSQASR | 0.000 | 0.930 | 0.070 | 0.000 | 0.000 | 0.000 | 0.000 | 0.000 | ||
| 3 spectra, GLLSGQTSPTNAR | 0.000 | 0.993 | 0.007 | 0.000 | 0.000 | 0.000 | 0.000 | 0.000 |
| Plot | Lyso | Other | |||||||||||
| Expt C |
7 peptides |
32 spectra |
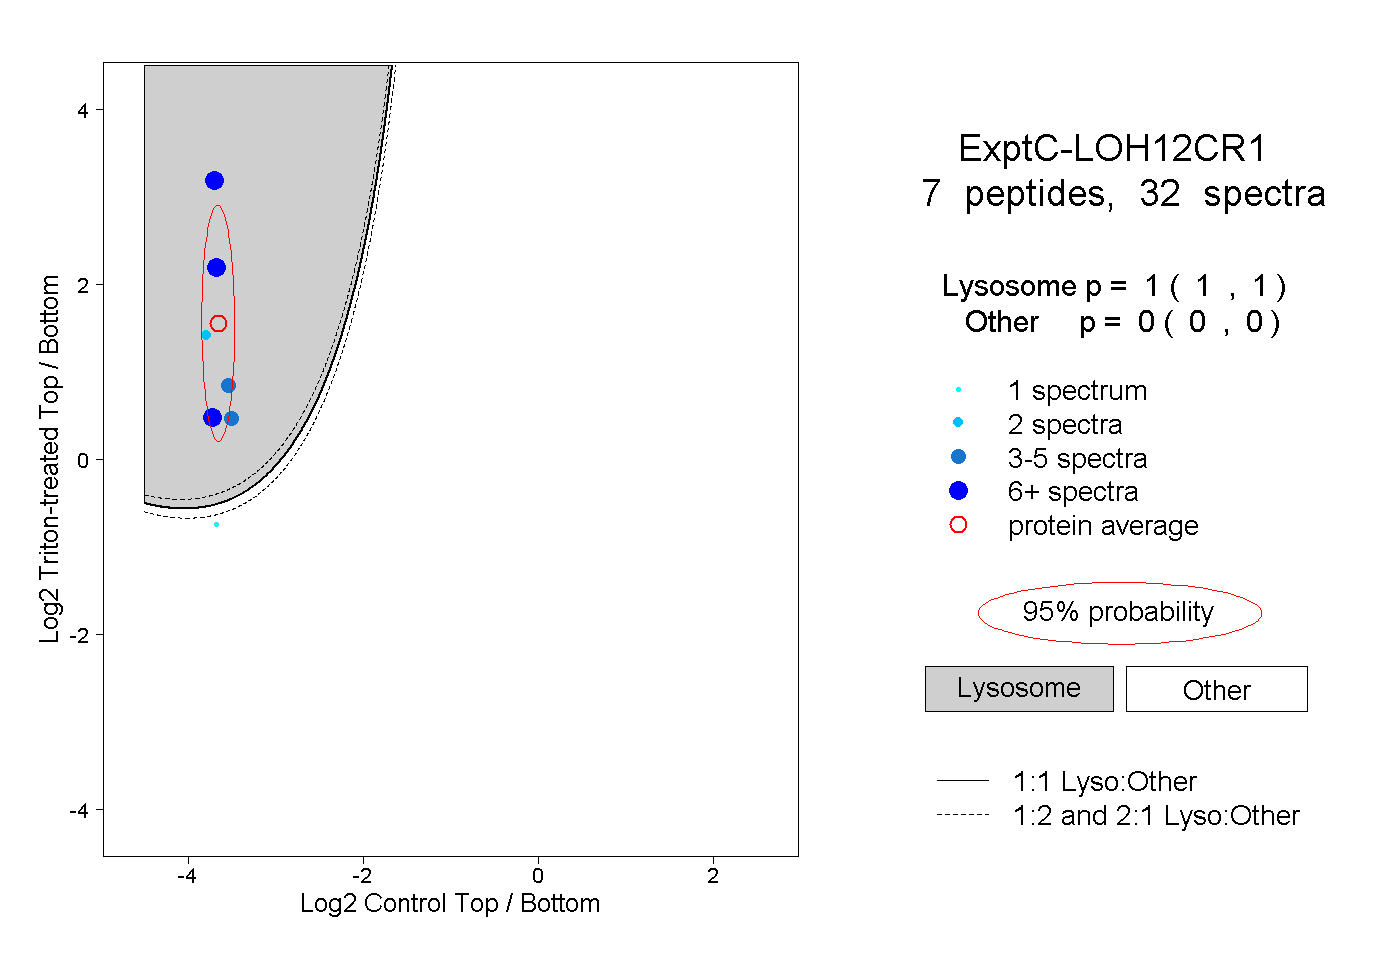 |
1.000 1.000 | 1.000 |
0.000 0.000 | 0.000 |
||||||||
| Plot | Lyso | Other | |||||||||||
| Expt D |
1 peptide |
1 spectrum |
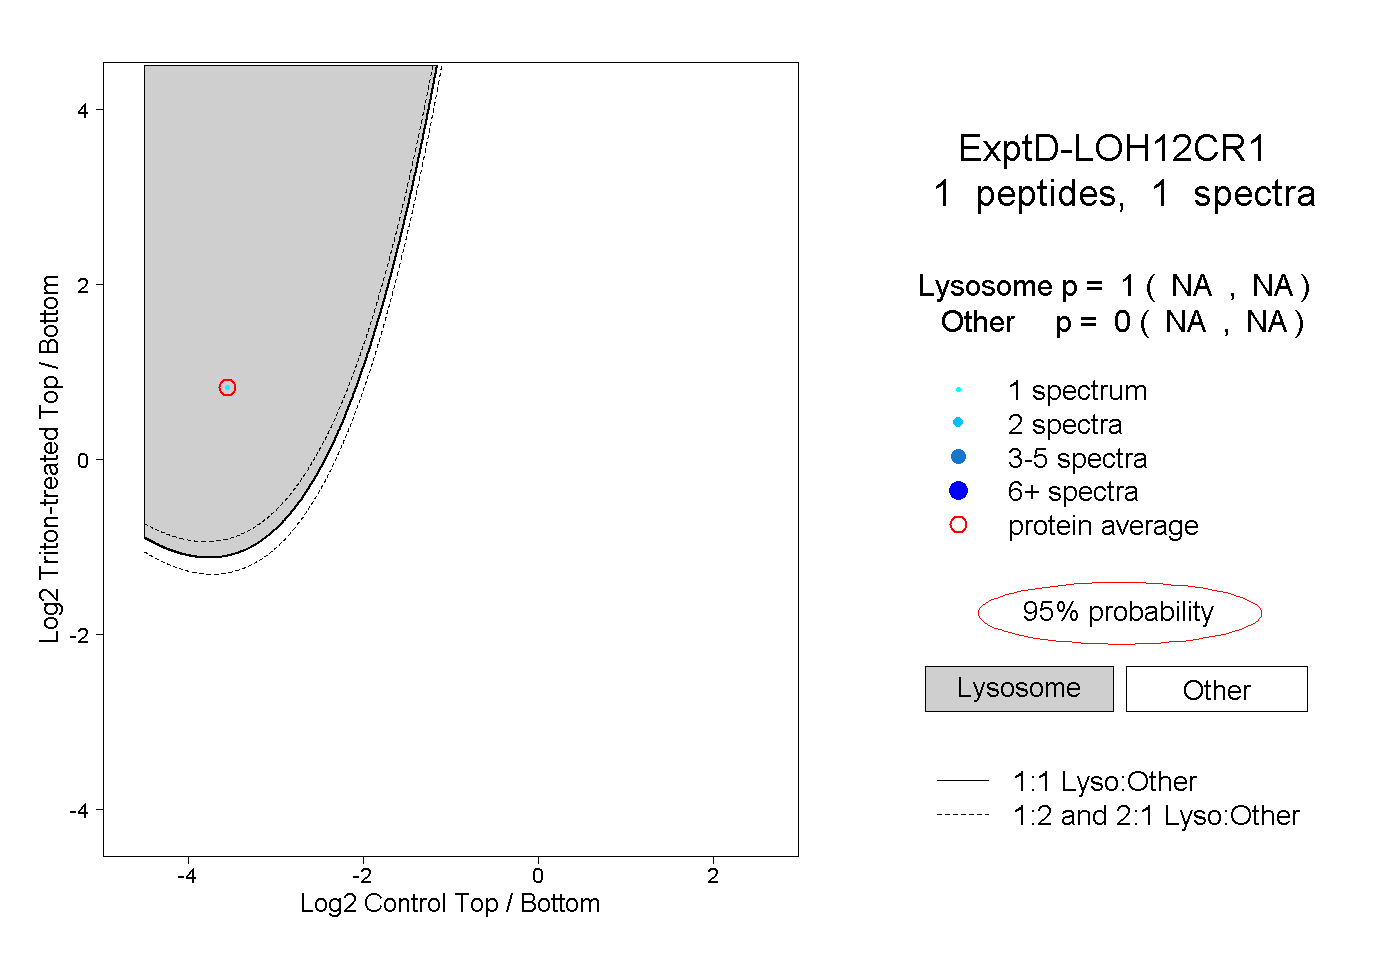 |
1.000 NA | NA |
0.000 NA | NA |