12
12peptides
spectra
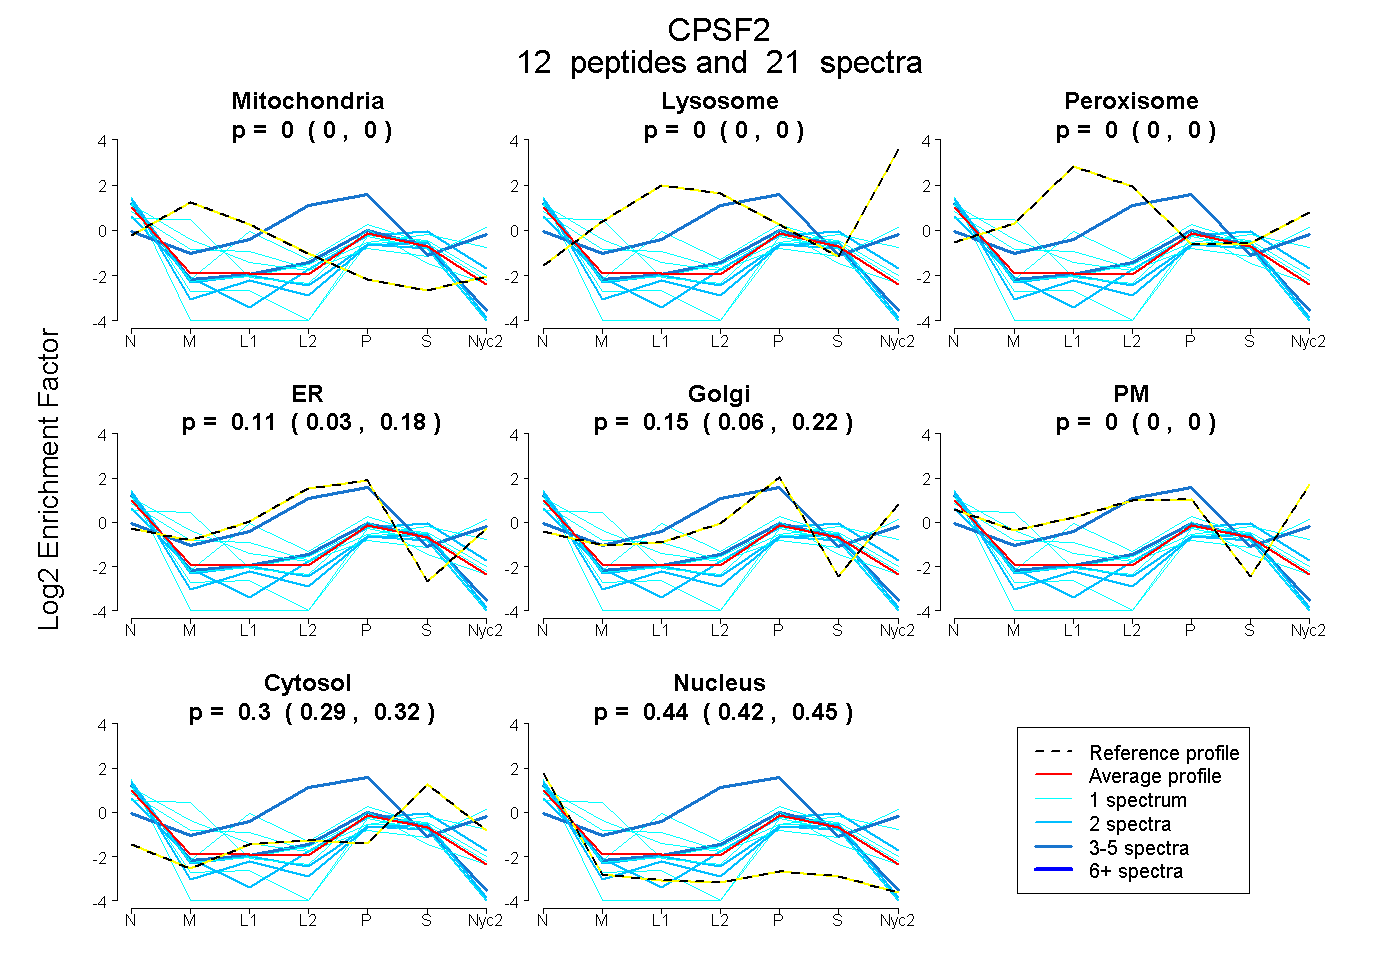
0.000 | 0.000
0.000 | 0.000
0.000 | 0.000
0.030 | 0.178
0.057 | 0.219
0.000 | 0.000
0.291 | 0.317
0.420 | 0.454
2peptides
spectra
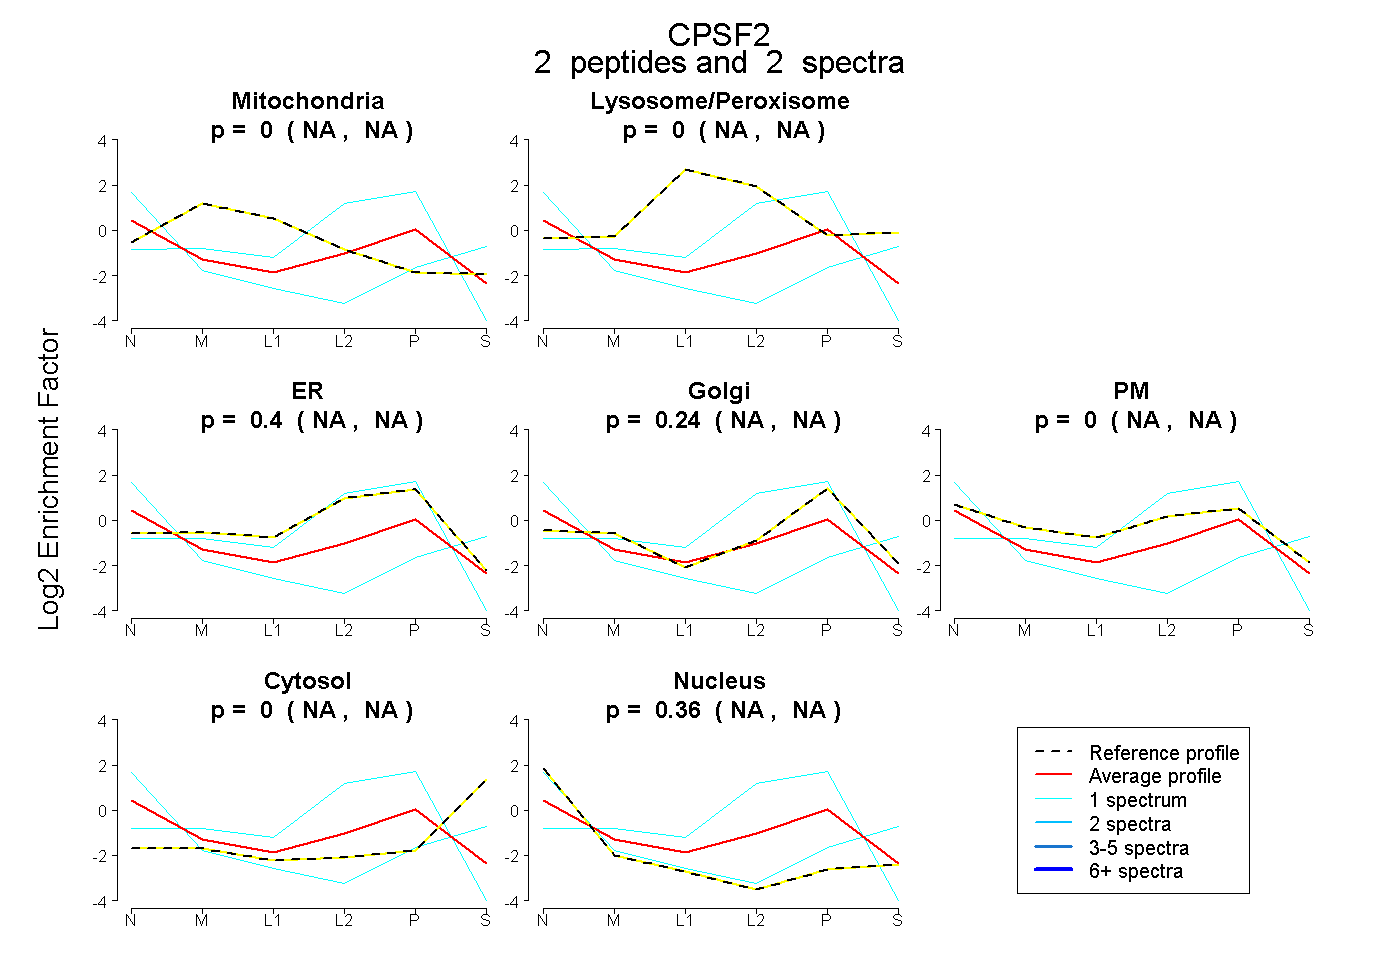
NA | NA
NA | NA
NA | NA
NA | NA
NA | NA
NA | NA
NA | NA
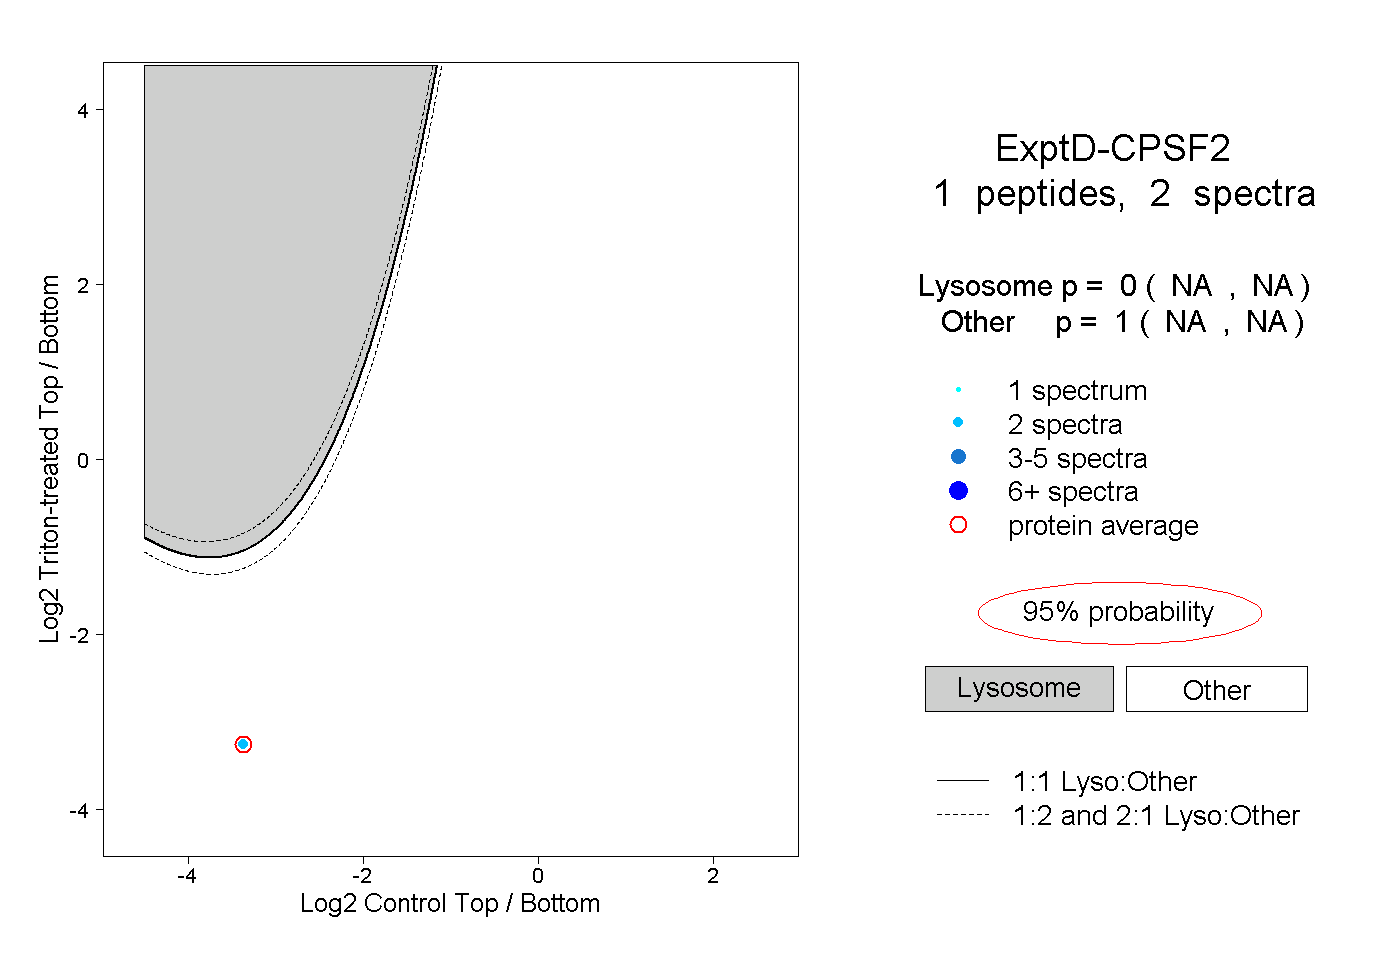
1peptide
spectra
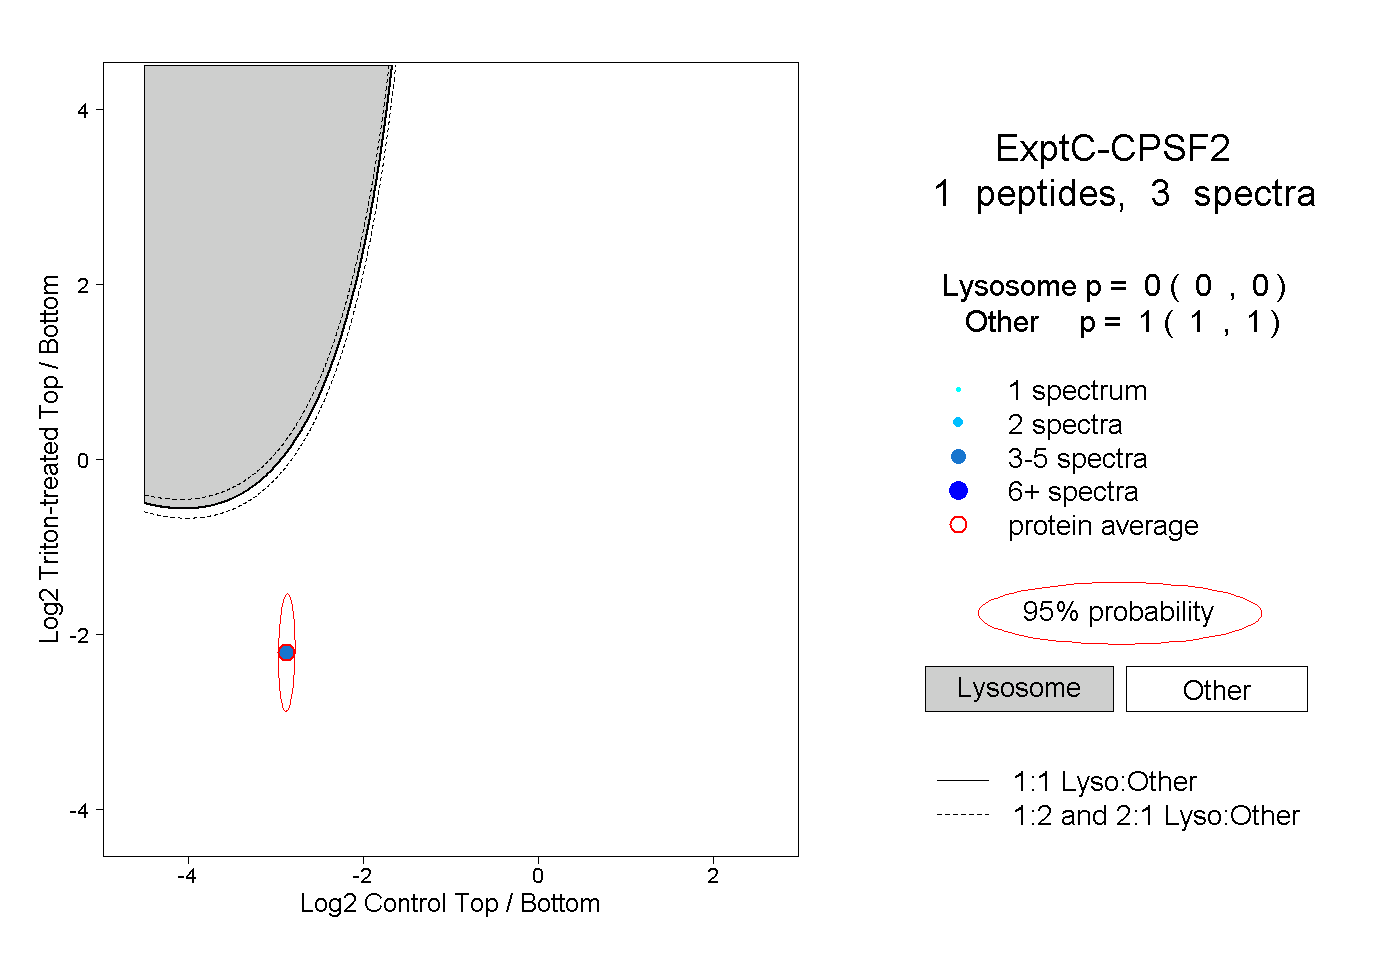
0.000 | 0.000
1.000 | 1.000