 7
7peptides
spectra
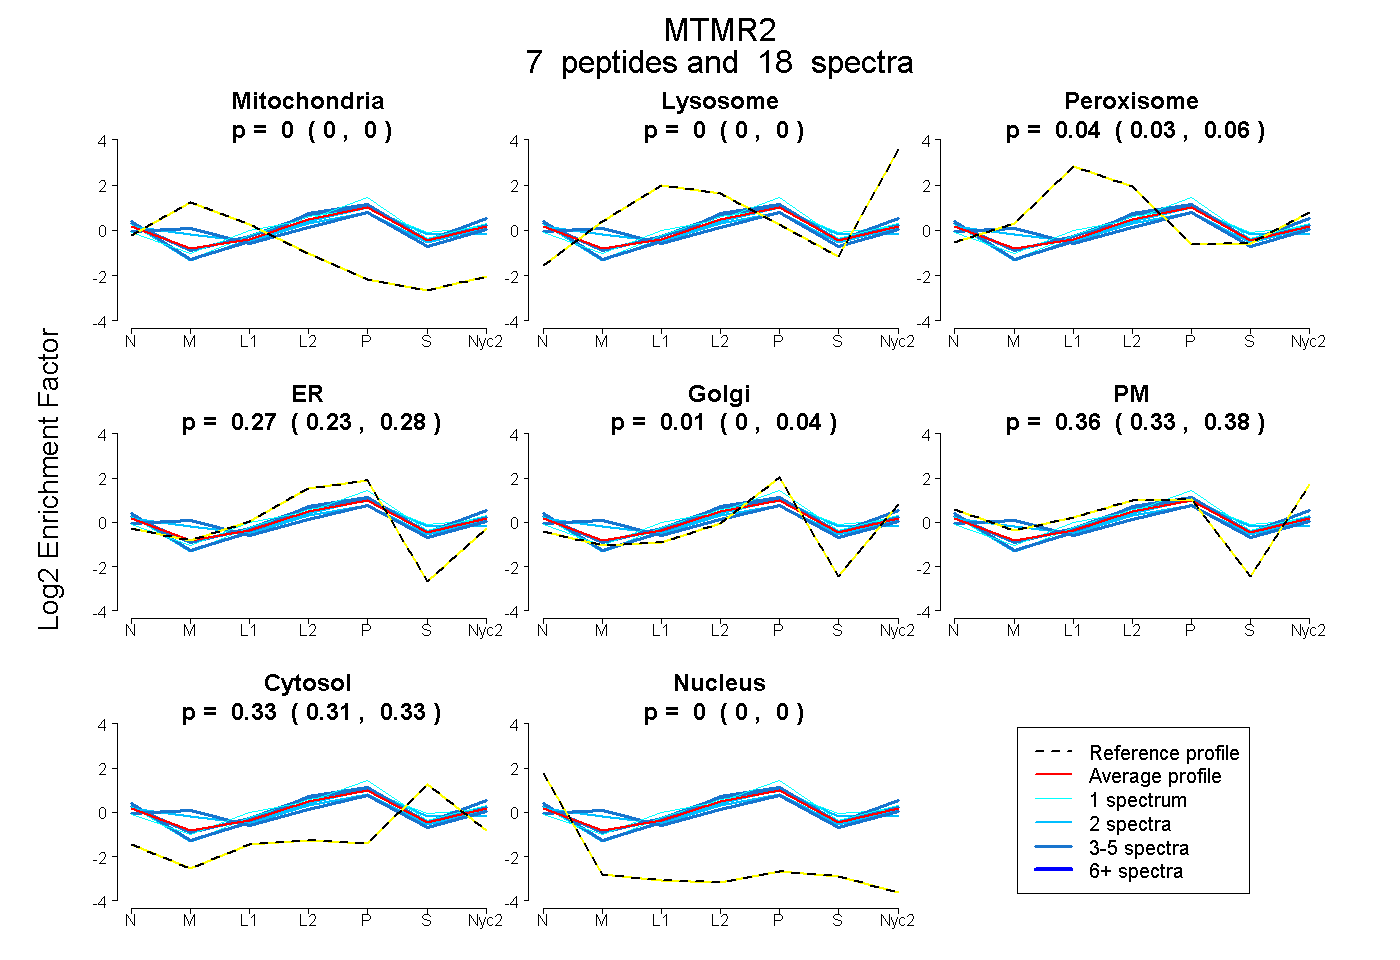
0.000 | 0.000
0.000 | 0.000
0.027 | 0.057
0.235 | 0.281
0.000 | 0.045
0.331 | 0.377
0.313 | 0.334
0.000 | 0.000
1peptide
spectrum

NA | NA
NA | NA
NA | NA
NA | NA
NA | NA
NA | NA
NA | NA
3peptides
spectra
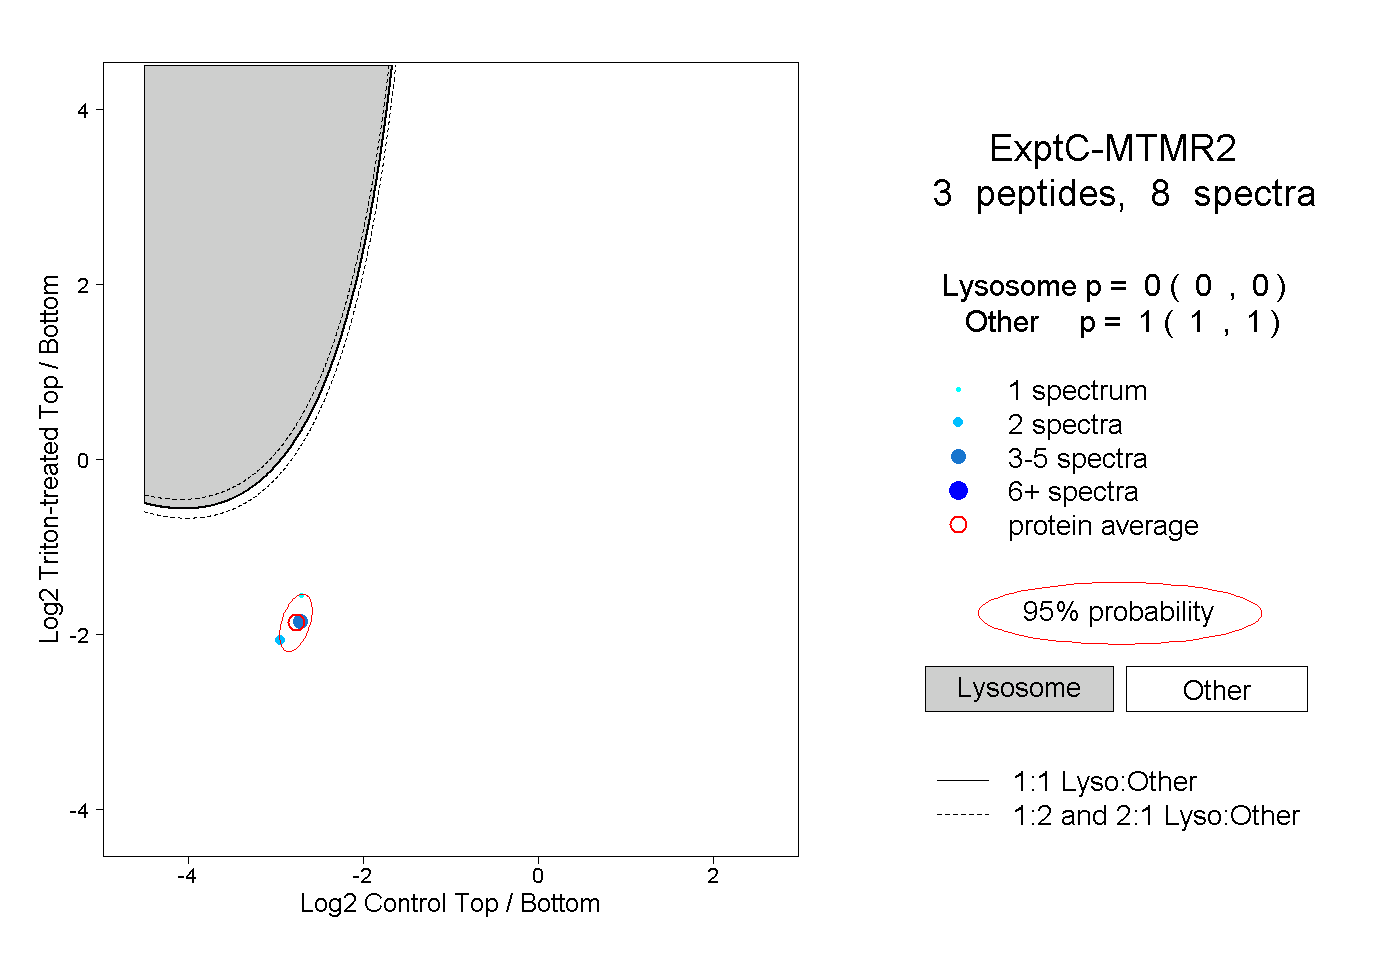
0.000 | 0.000
1.000 | 1.000
1peptide
spectrum

NA | NA
NA | NA