 4
4peptides
spectra
0.000 | 0.182
0.000 | 0.000
0.044 | 0.211
0.045 | 0.325
0.000 | 0.132
0.000 | 0.055
0.422 | 0.592
0.000 | 0.049
4peptides
spectra
0.000 | 0.000
1.000 | 1.000
| Plot | Mito | Lyso | Perox | ER | Golgi | PM | Cytosol | Nucleus | |||||
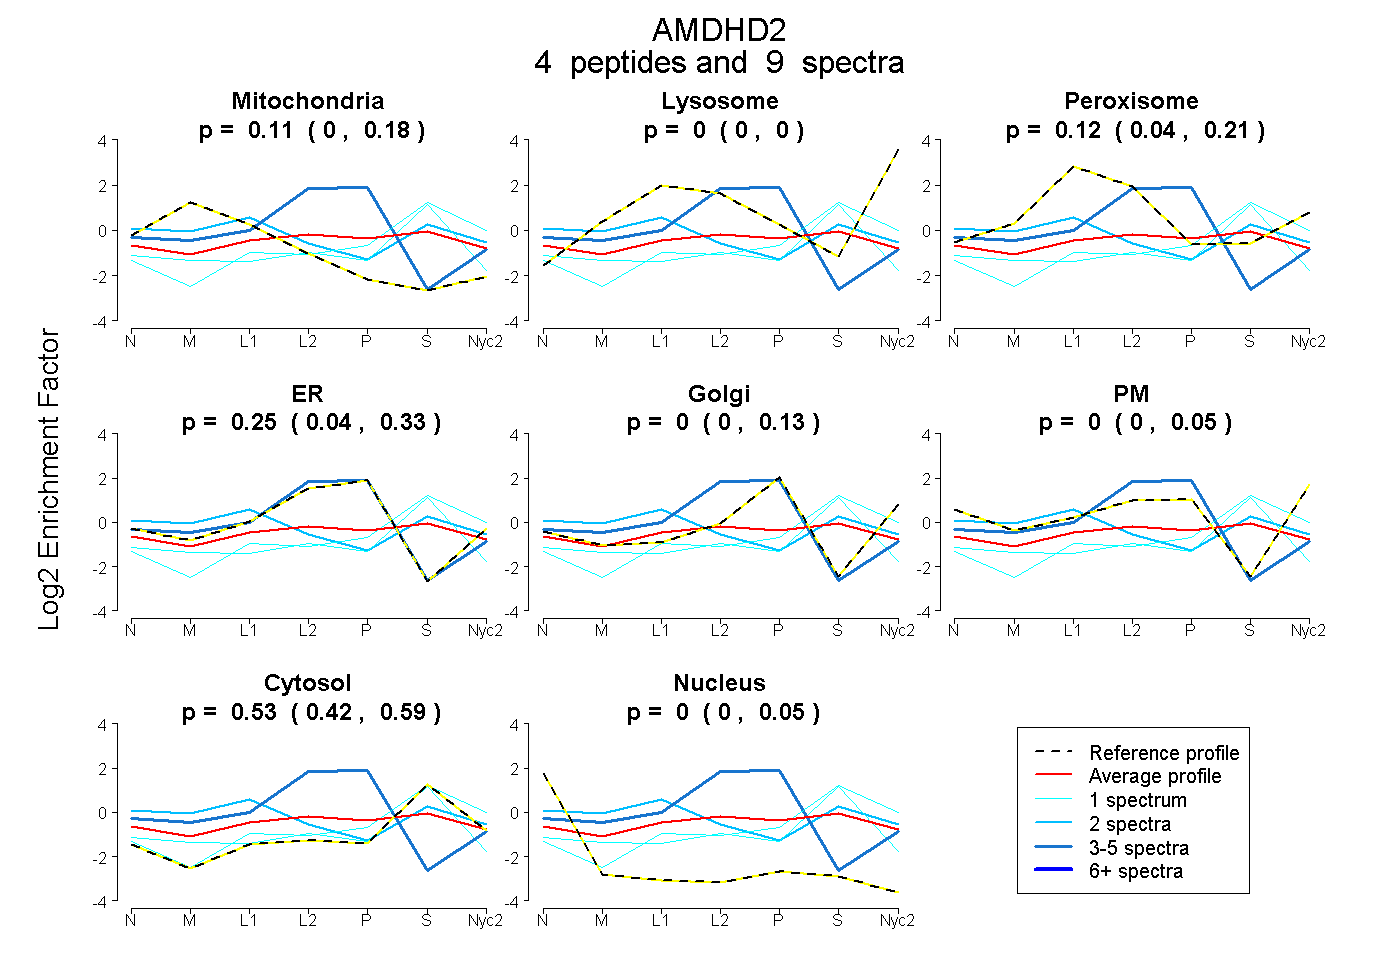
| Expt A |
4 peptides |
9 spectra |
|
0.108 0.000 | 0.182 |
0.000 0.000 | 0.000 |
0.118 0.044 | 0.211 |
0.248 0.045 | 0.325 |
0.000 0.000 | 0.132 |
0.000 0.000 | 0.055 |
0.525 0.422 | 0.592 |
0.000 0.000 | 0.049 |
||
| Plot | Lyso | Other | |||||||||||
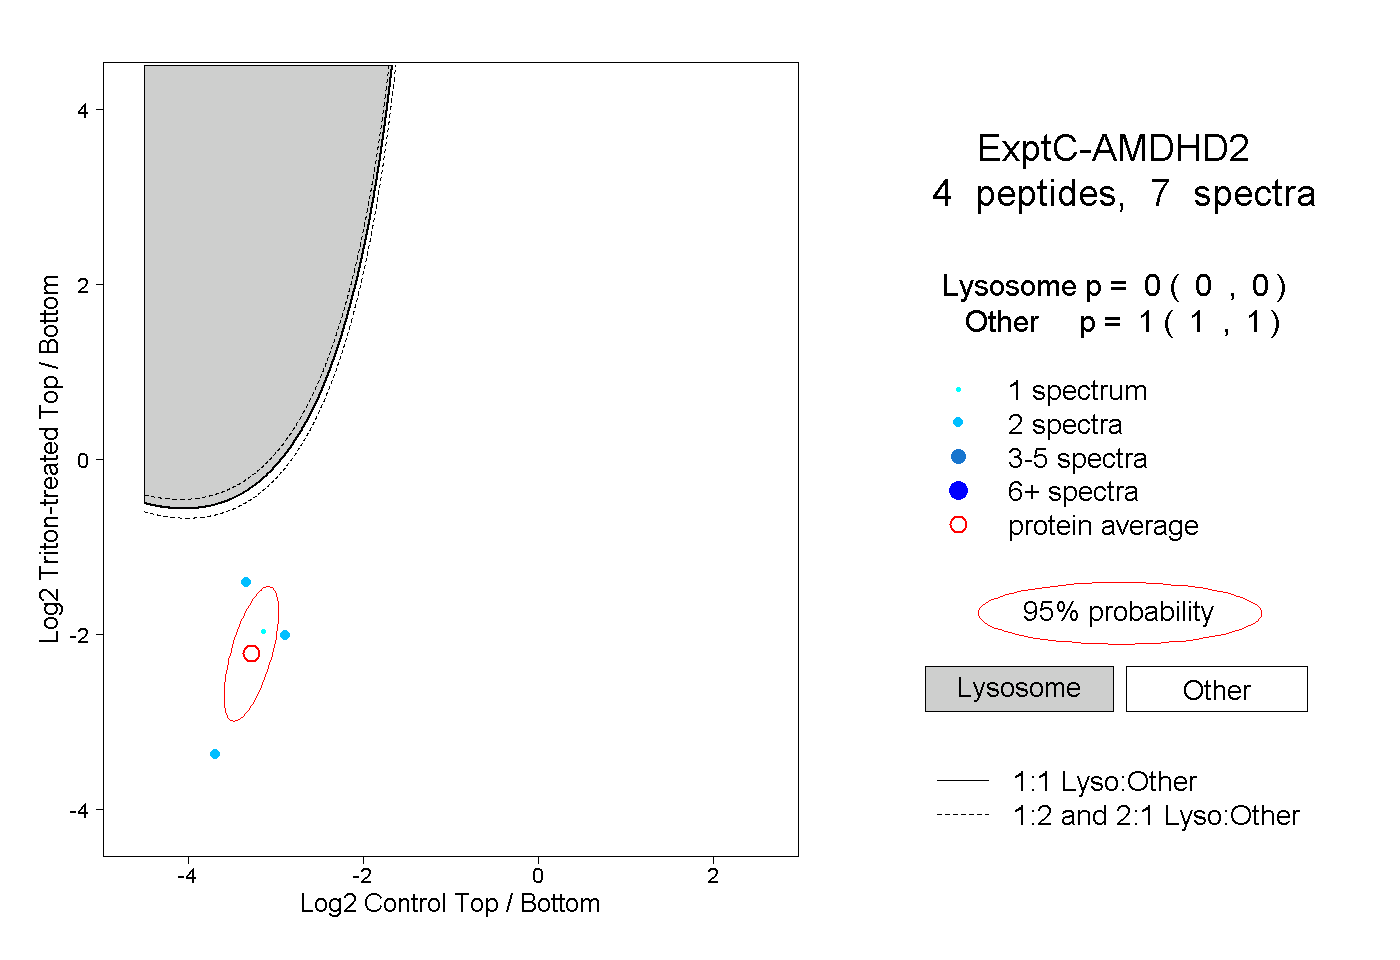
| Expt C |
4 peptides |
7 spectra |
|
0.000 0.000 | 0.000 |
1.000 1.000 | 1.000 |