GALK1
[ENSRNOP00000008525]
Main page
| | | Plot |
Mito |
Lyso |
|
Perox |
ER |
Golgi |
PM |
Cytosol |
Nucleus |
|
| Expt A |
 10
10
peptides |
70
spectra |
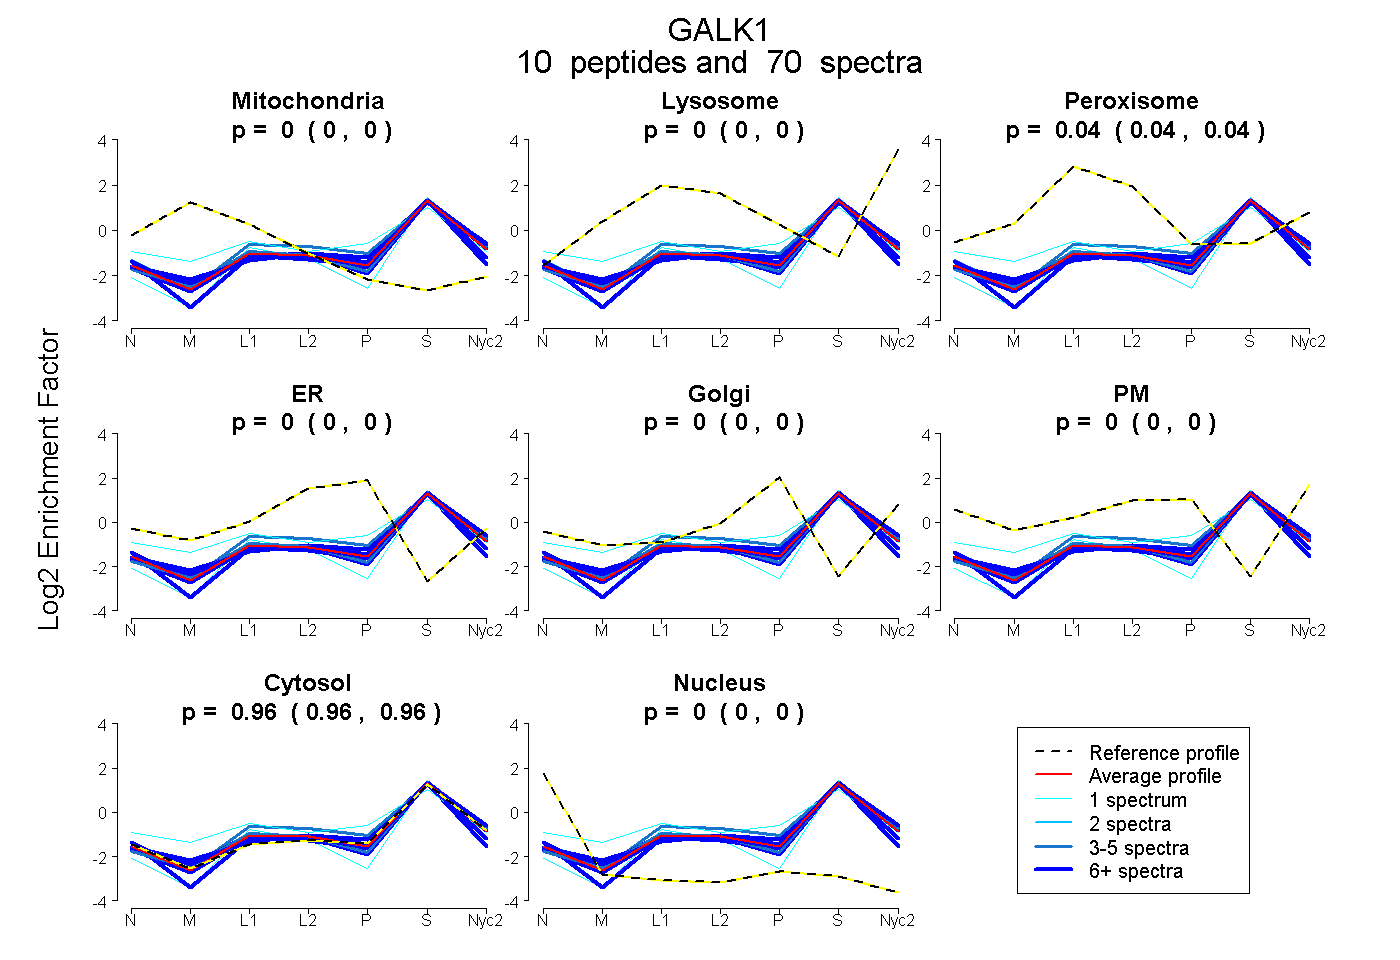 |
0.000
0.000 | 0.000 |
0.000
0.000 | 0.000 |
|
0.039
0.036 | 0.042 |
0.000
0.000 | 0.000 |
0.000
0.000 | 0.000 |
0.000
0.000 | 0.000 |
0.961
0.958 | 0.963 |
0.000
0.000 | 0.000 |
|
| | | Plot |
Mito |
|
Lyso or Perox |
|
ER |
Golgi |
PM |
Cytosol |
Nucleus |
|
| Expt B |
8
peptides |
26
spectra |
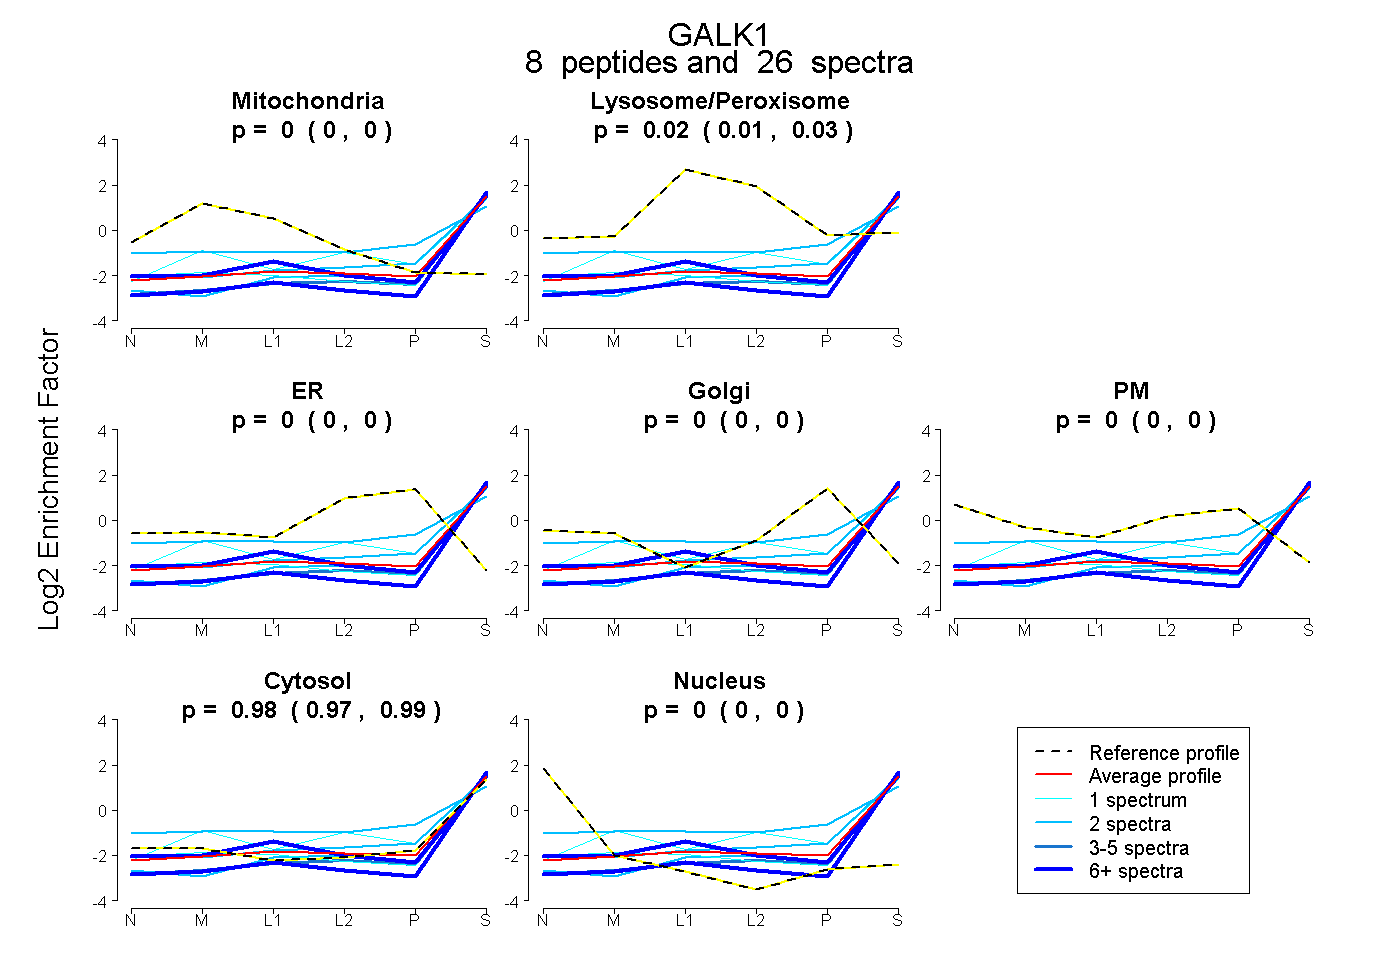 |
0.000
0.000 | 0.000 |
|
0.018
0.007 | 0.027 |
|
0.000
0.000 | 0.000 |
0.000
0.000 | 0.000 |
0.000
0.000 | 0.000 |
0.982
0.971 | 0.991 |
0.000
0.000 | 0.000 |
|
| 7 spectra, VEELLAEAR |
0.000 |
|
0.000 |
|
0.000 |
0.000 |
0.000 |
1.000 |
0.000 |
|
| 1 spectrum, QCEEVAQALGK |
0.000 |
|
0.000 |
|
0.000 |
0.000 |
0.000 |
1.000 |
0.000 |
|
| 1 spectrum, HVVSEIR |
0.000 |
|
0.152 |
|
0.009 |
0.000 |
0.000 |
0.839 |
0.000 |
|
| 6 spectra, TAQGAAALSR |
0.000 |
|
0.050 |
|
0.000 |
0.000 |
0.000 |
0.950 |
0.000 |
|
| 5 spectra, MEELEAGR |
0.000 |
|
0.000 |
|
0.000 |
0.000 |
0.000 |
1.000 |
0.000 |
|
| 2 spectra, GYALLIDCR |
0.000 |
|
0.000 |
|
0.000 |
0.000 |
0.000 |
1.000 |
0.000 |
|
| 2 spectra, TDGLVSLLTTSK |
0.000 |
|
0.258 |
|
0.000 |
0.121 |
0.000 |
0.621 |
0.000 |
|
| 2 spectra, LTVLITNSNVR |
0.000 |
|
0.068 |
|
0.000 |
0.000 |
0.000 |
0.932 |
0.000 |
|
| | | Plot |
|
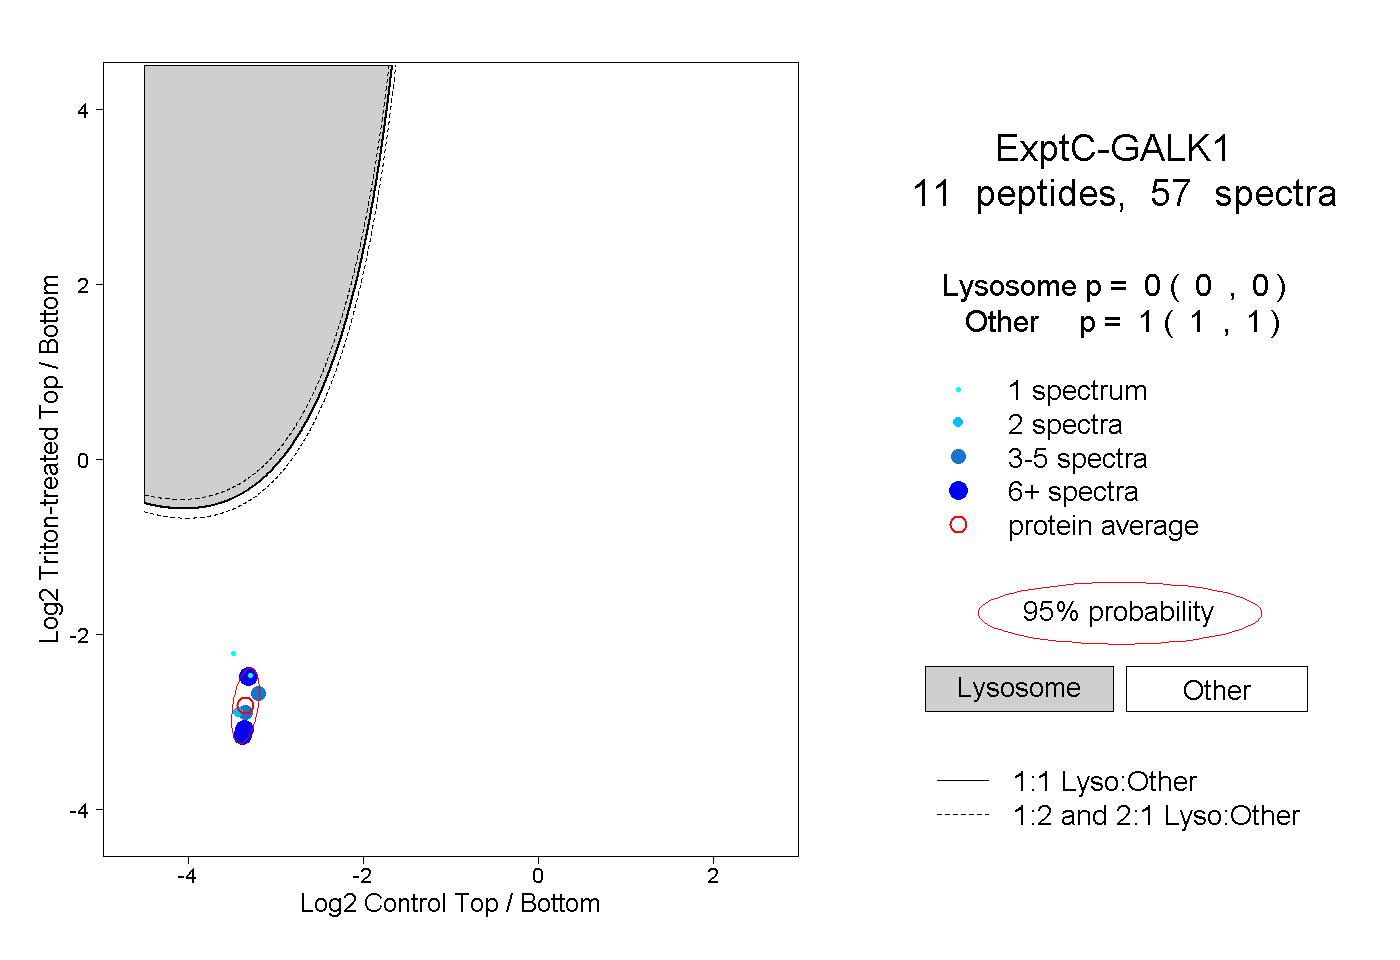
Lyso |
|
|
|
|
|
|
|
Other |
| Expt C |
11
peptides |
57
spectra |
 |
|
0.000
0.000 | 0.000 |
|
|
|
|
|
|
|
1.000
1.000 | 1.000 |
| | | Plot |
|
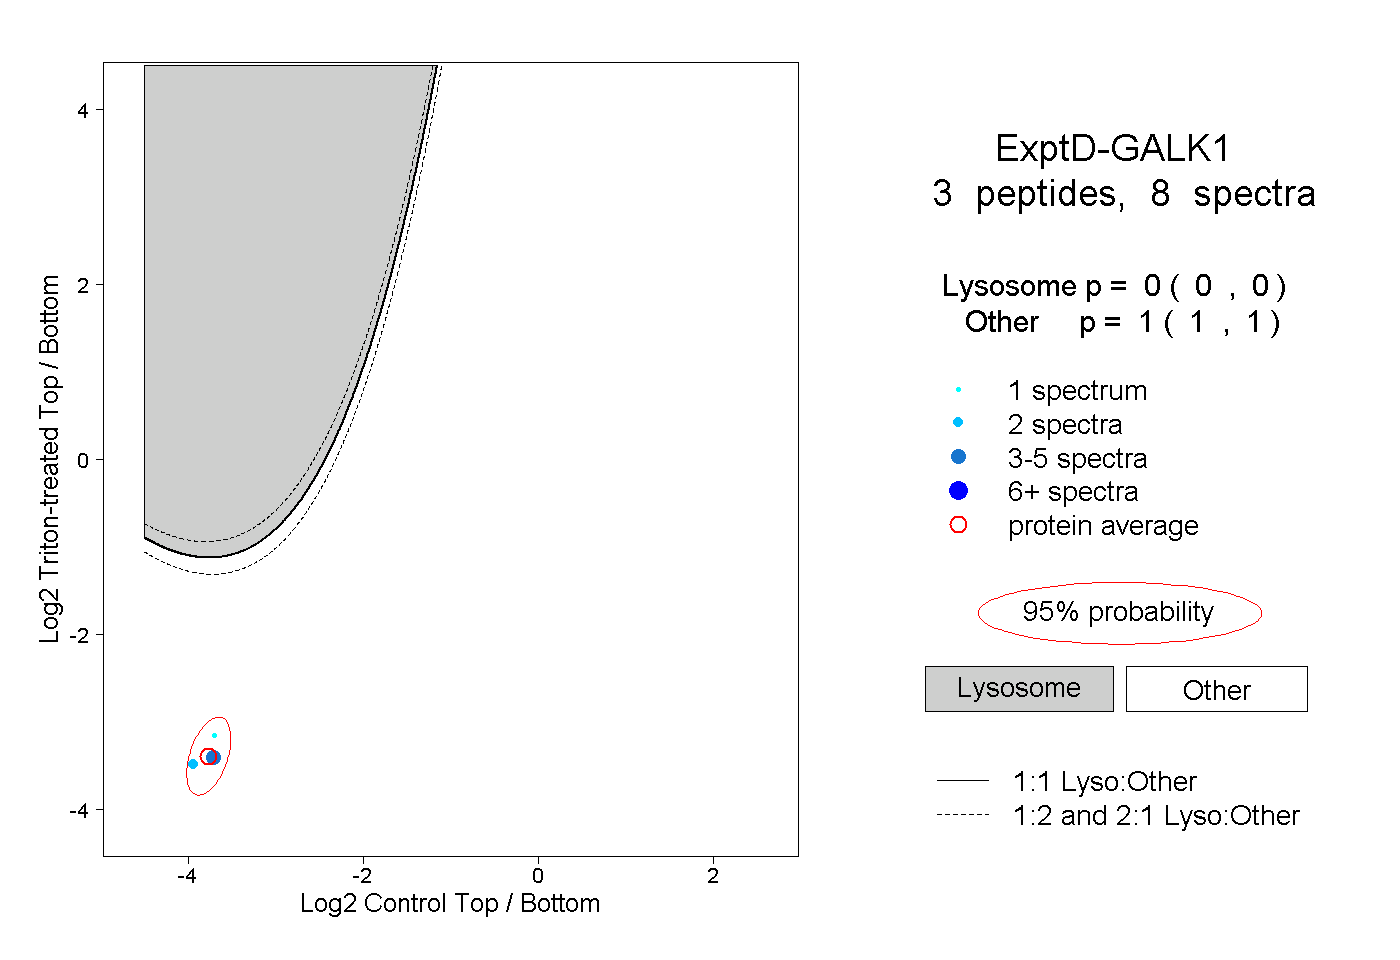
Lyso |
|
|
|
|
|
|
|
Other |
| Expt D |
3
peptides |
8
spectra |
 |
|
0.000
0.000 | 0.000 |
|
|
|
|
|
|
|
1.000
1.000 | 1.000 |