 6
6peptides
spectra
0.000 | 0.000
0.653 | 0.759
0.136 | 0.232
0.000 | 0.000
0.000 | 0.000
0.035 | 0.101
0.003 | 0.046
0.000 | 0.000
| Plot | Mito | Lyso | Perox | ER | Golgi | PM | Cytosol | Nucleus | |||||
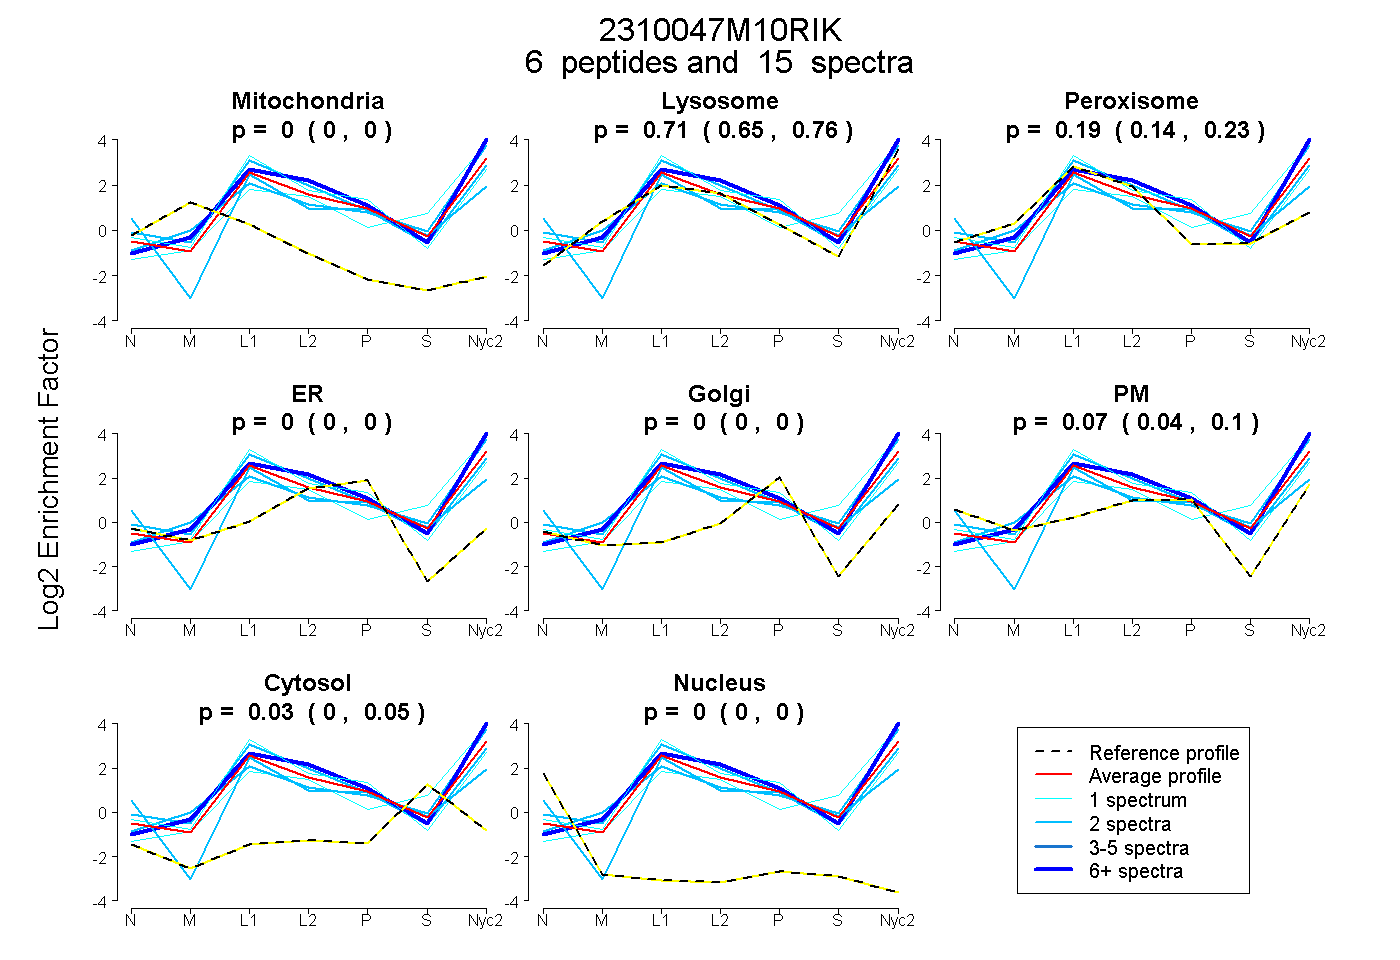
| Expt A |
6 peptides |
15 spectra |
|
0.000 0.000 | 0.000 |
0.714 0.653 | 0.759 |
0.188 0.136 | 0.232 |
0.000 0.000 | 0.000 |
0.000 0.000 | 0.000 |
0.072 0.035 | 0.101 |
0.026 0.003 | 0.046 |
0.000 0.000 | 0.000 |
| 2 spectra, ATISSPLELEGTVSR | 0.000 | 0.558 | 0.378 | 0.000 | 0.000 | 0.064 | 0.000 | 0.000 | ||
| 2 spectra, TLSGEEEAESVGVASR | 0.000 | 0.133 | 0.350 | 0.000 | 0.000 | 0.340 | 0.176 | 0.000 | ||
| 1 spectrum, HPRPSPK | 0.000 | 0.566 | 0.328 | 0.046 | 0.000 | 0.061 | 0.000 | 0.000 | ||
| 2 spectra, DAVDSLGEAVDMSIK | 0.000 | 0.940 | 0.000 | 0.000 | 0.000 | 0.000 | 0.060 | 0.000 | ||
| 1 spectrum, ALQPVQGLAR | 0.000 | 0.858 | 0.000 | 0.000 | 0.000 | 0.000 | 0.142 | 0.000 | ||
| 7 spectra, GMYTLLAR | 0.000 | 1.000 | 0.000 | 0.000 | 0.000 | 0.000 | 0.000 | 0.000 |
| Plot | Mito | Lyso or Perox | ER | Golgi | PM | Cytosol | Nucleus | ||||||
| Expt B |
1 peptide |
1 spectrum |
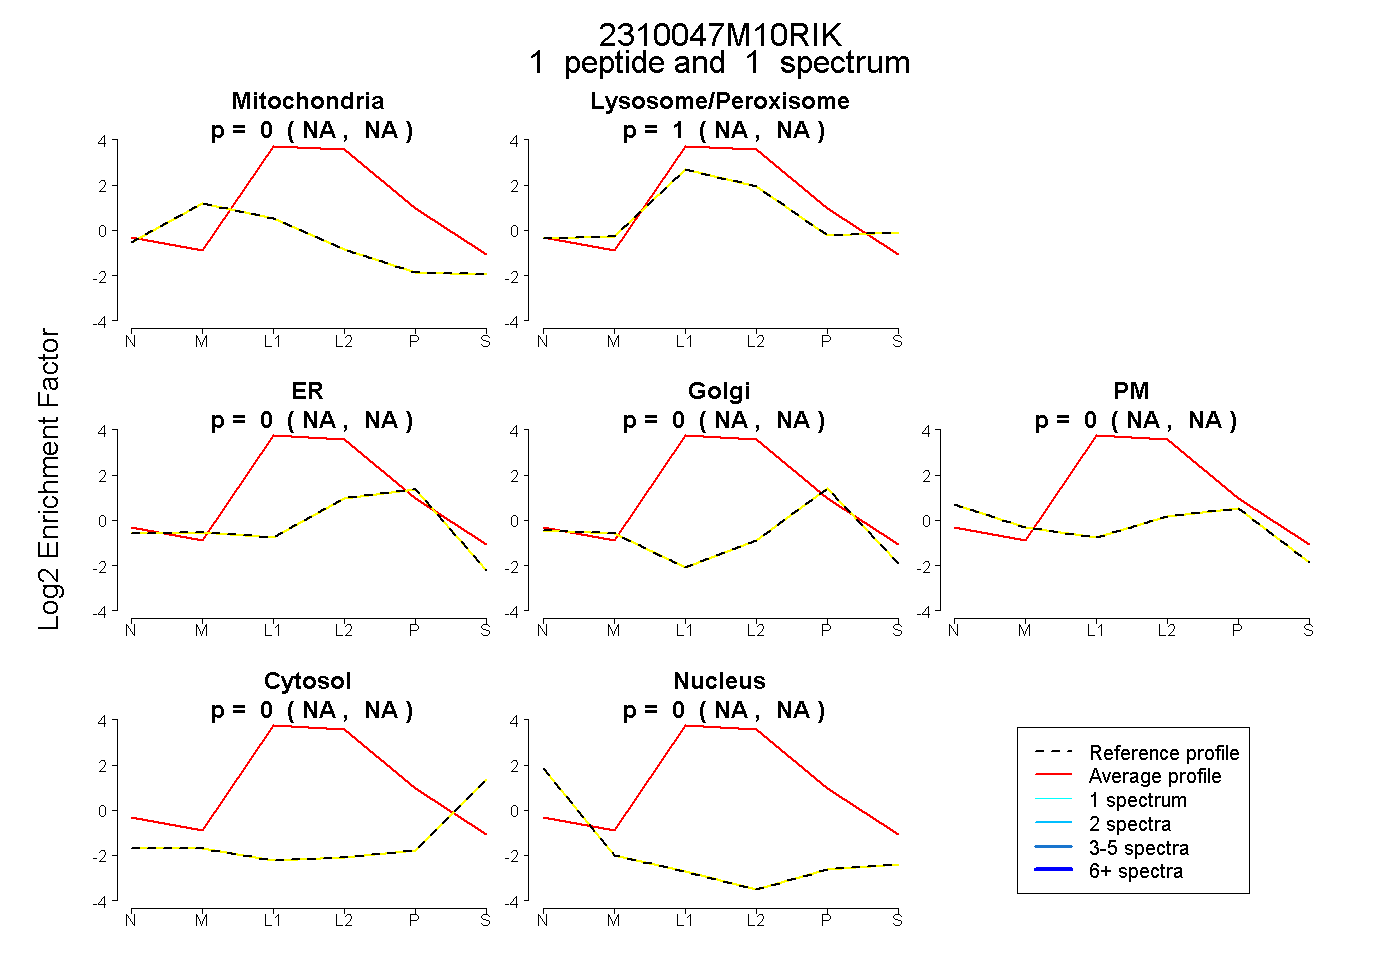 |
0.000 NA | NA |
1.000 NA | NA |
0.000 NA | NA |
0.000 NA | NA |
0.000 NA | NA |
0.000 NA | NA |
0.000 NA | NA |
|||
| Plot | Lyso | Other | |||||||||||
| Expt C |
4 peptides |
9 spectra |
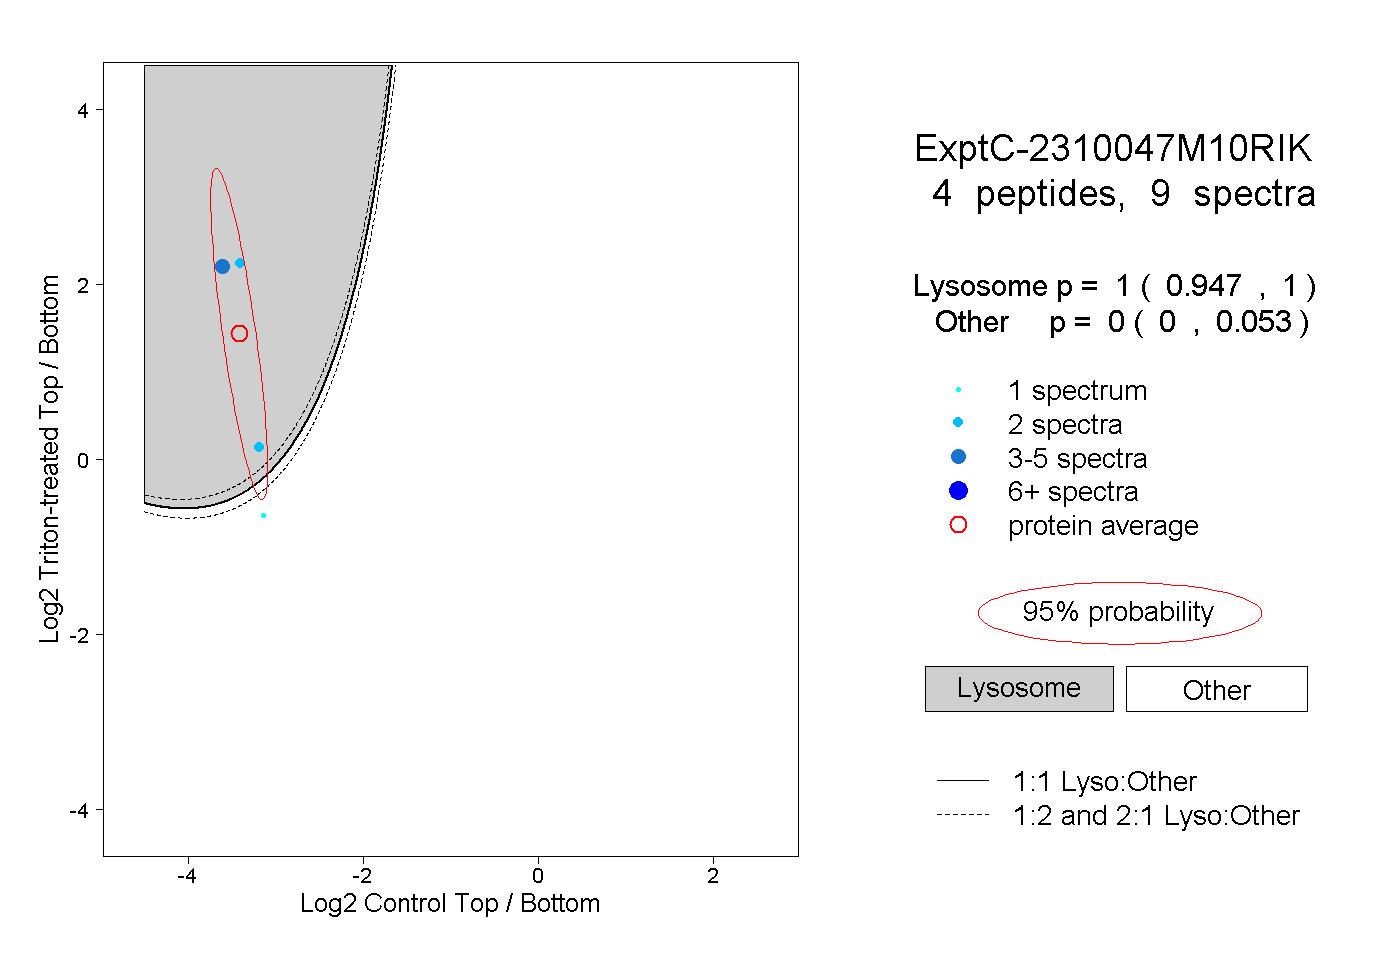 |
1.000 0.947 | 1.000 |
0.000 0.000 | 0.053 |
||||||||
| Plot | Lyso | Other | |||||||||||
| Expt D |
1 peptide |
1 spectrum |
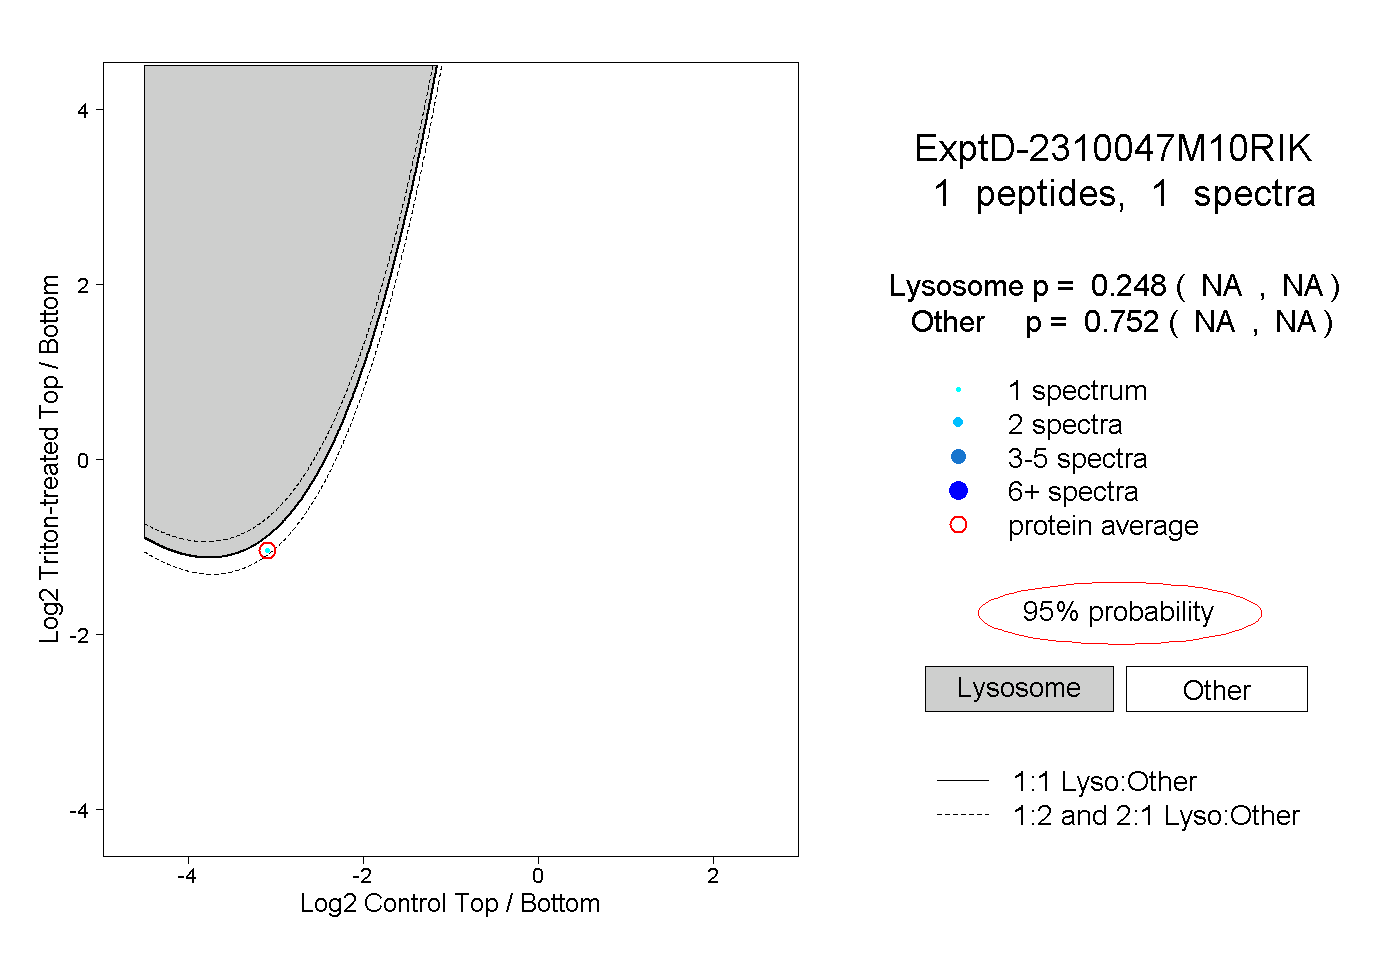 |
0.248 NA | NA |
0.752 NA | NA |