 21
21peptides
spectra
0.886 | 0.890
0.000 | 0.000
0.000 | 0.000
0.089 | 0.100
0.010 | 0.019
0.000 | 0.004
0.000 | 0.000
0.000 | 0.000
| Plot | Mito | Lyso | Perox | ER | Golgi | PM | Cytosol | Nucleus | |||||
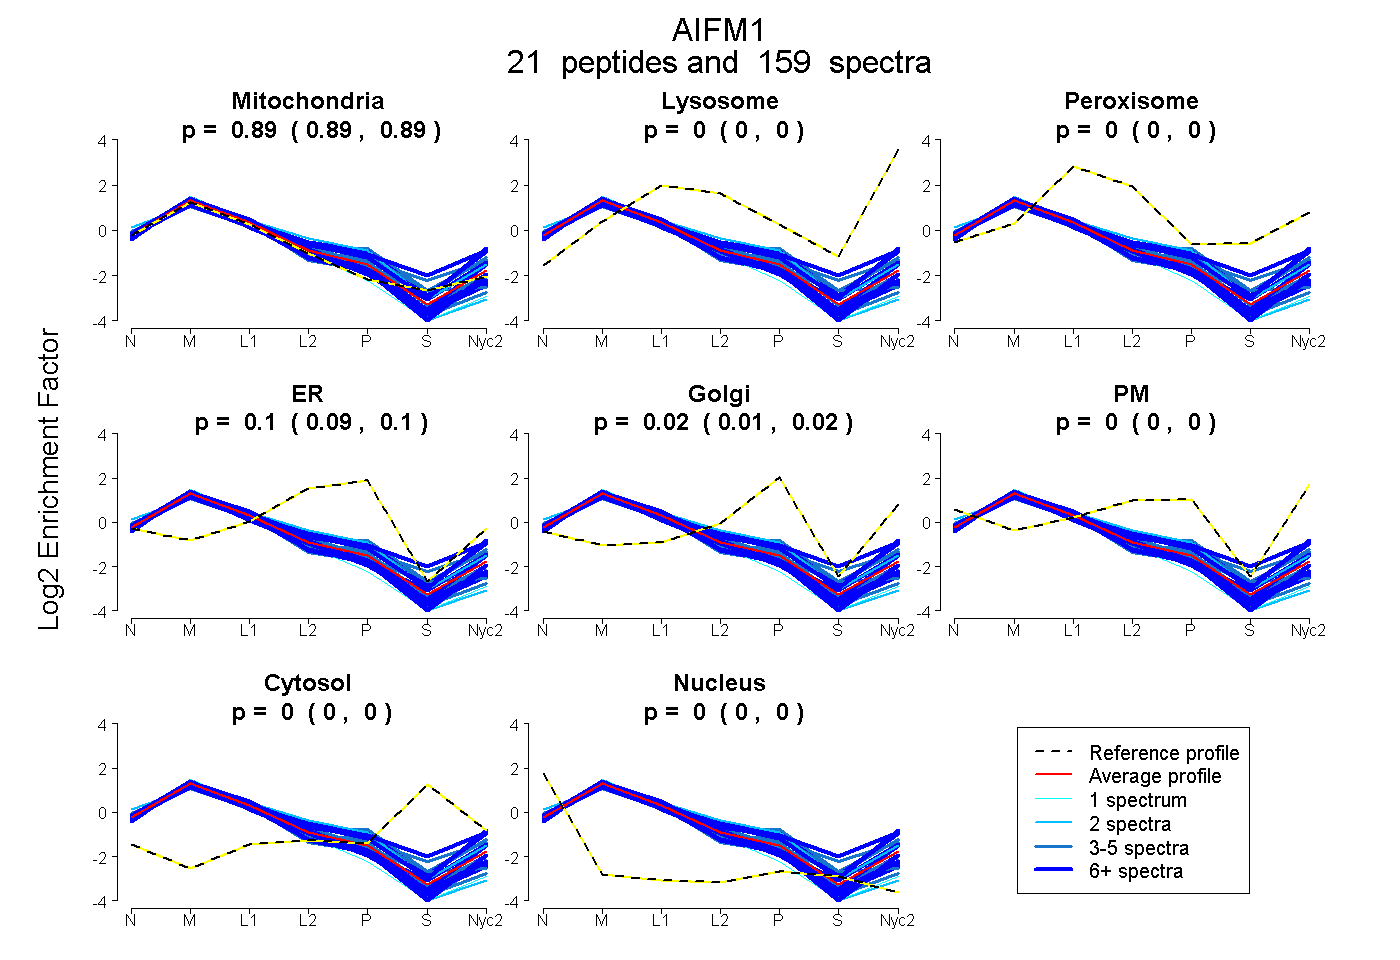
| Expt A |
21 peptides |
159 spectra |
|
0.889 0.886 | 0.890 |
0.000 0.000 | 0.000 |
0.000 0.000 | 0.000 |
0.096 0.089 | 0.100 |
0.015 0.010 | 0.019 |
0.000 0.000 | 0.004 |
0.000 0.000 | 0.000 |
0.000 0.000 | 0.000 |
| 5 spectra, SNIWVAGDAACFYDIK | 0.895 | 0.000 | 0.000 | 0.105 | 0.000 | 0.000 | 0.000 | 0.000 | ||
| 4 spectra, GVIFYLR | 0.989 | 0.000 | 0.000 | 0.006 | 0.005 | 0.000 | 0.000 | 0.000 | ||
| 8 spectra, VLIVSEDPELPYMRPPLSK | 0.971 | 0.000 | 0.000 | 0.029 | 0.000 | 0.000 | 0.000 | 0.000 | ||
| 3 spectra, ATAQDNPK | 0.958 | 0.000 | 0.000 | 0.042 | 0.000 | 0.000 | 0.000 | 0.000 | ||
| 5 spectra, ELWFSDDPNVTK | 0.800 | 0.050 | 0.040 | 0.000 | 0.106 | 0.000 | 0.004 | 0.000 | ||
| 8 spectra, TGGLEIDSDFGGFR | 0.923 | 0.000 | 0.000 | 0.000 | 0.000 | 0.077 | 0.000 | 0.000 | ||
| 4 spectra, MPIAR | 0.907 | 0.000 | 0.000 | 0.091 | 0.002 | 0.000 | 0.000 | 0.000 | ||
| 9 spectra, VNAELQAR | 0.971 | 0.000 | 0.000 | 0.000 | 0.029 | 0.000 | 0.000 | 0.000 | ||
| 9 spectra, SLSAIDR | 0.714 | 0.054 | 0.000 | 0.052 | 0.035 | 0.144 | 0.000 | 0.000 | ||
| 2 spectra, VEHHDHAVVSGR | 0.724 | 0.000 | 0.000 | 0.196 | 0.000 | 0.080 | 0.000 | 0.000 | ||
| 7 spectra, DGEQHEDLNEVAK | 0.919 | 0.000 | 0.000 | 0.081 | 0.000 | 0.000 | 0.000 | 0.000 | ||
| 1 spectrum, SITVIGGGFLGSELACALGR | 0.997 | 0.000 | 0.000 | 0.000 | 0.000 | 0.000 | 0.000 | 0.003 | ||
| 16 spectra, CLIATGGTPR | 0.922 | 0.000 | 0.000 | 0.078 | 0.000 | 0.000 | 0.000 | 0.000 | ||
| 29 spectra, SATEQSGTGIR | 0.976 | 0.000 | 0.000 | 0.011 | 0.013 | 0.000 | 0.000 | 0.000 | ||
| 11 spectra, VMPNAIVQSVGVSGGK | 0.700 | 0.107 | 0.009 | 0.000 | 0.127 | 0.032 | 0.026 | 0.000 | ||
| 9 spectra, TTLFR | 0.896 | 0.036 | 0.000 | 0.000 | 0.021 | 0.047 | 0.000 | 0.000 | ||
| 8 spectra, ILPEYLSNWTMEK | 0.969 | 0.000 | 0.000 | 0.031 | 0.000 | 0.000 | 0.000 | 0.000 | ||
| 4 spectra, IMGLGLSPEEK | 0.724 | 0.000 | 0.000 | 0.055 | 0.135 | 0.086 | 0.000 | 0.000 | ||
| 5 spectra, LNDGSQITFEK | 0.809 | 0.000 | 0.000 | 0.000 | 0.000 | 0.191 | 0.000 | 0.000 | ||
| 2 spectra, LFNIHED | 0.974 | 0.000 | 0.000 | 0.000 | 0.000 | 0.000 | 0.000 | 0.026 | ||
| 10 spectra, VVHLDVR | 0.728 | 0.039 | 0.000 | 0.000 | 0.000 | 0.233 | 0.000 | 0.000 |
| Plot | Mito | Lyso or Perox | ER | Golgi | PM | Cytosol | Nucleus | ||||||
| Expt B |
22 peptides |
86 spectra |
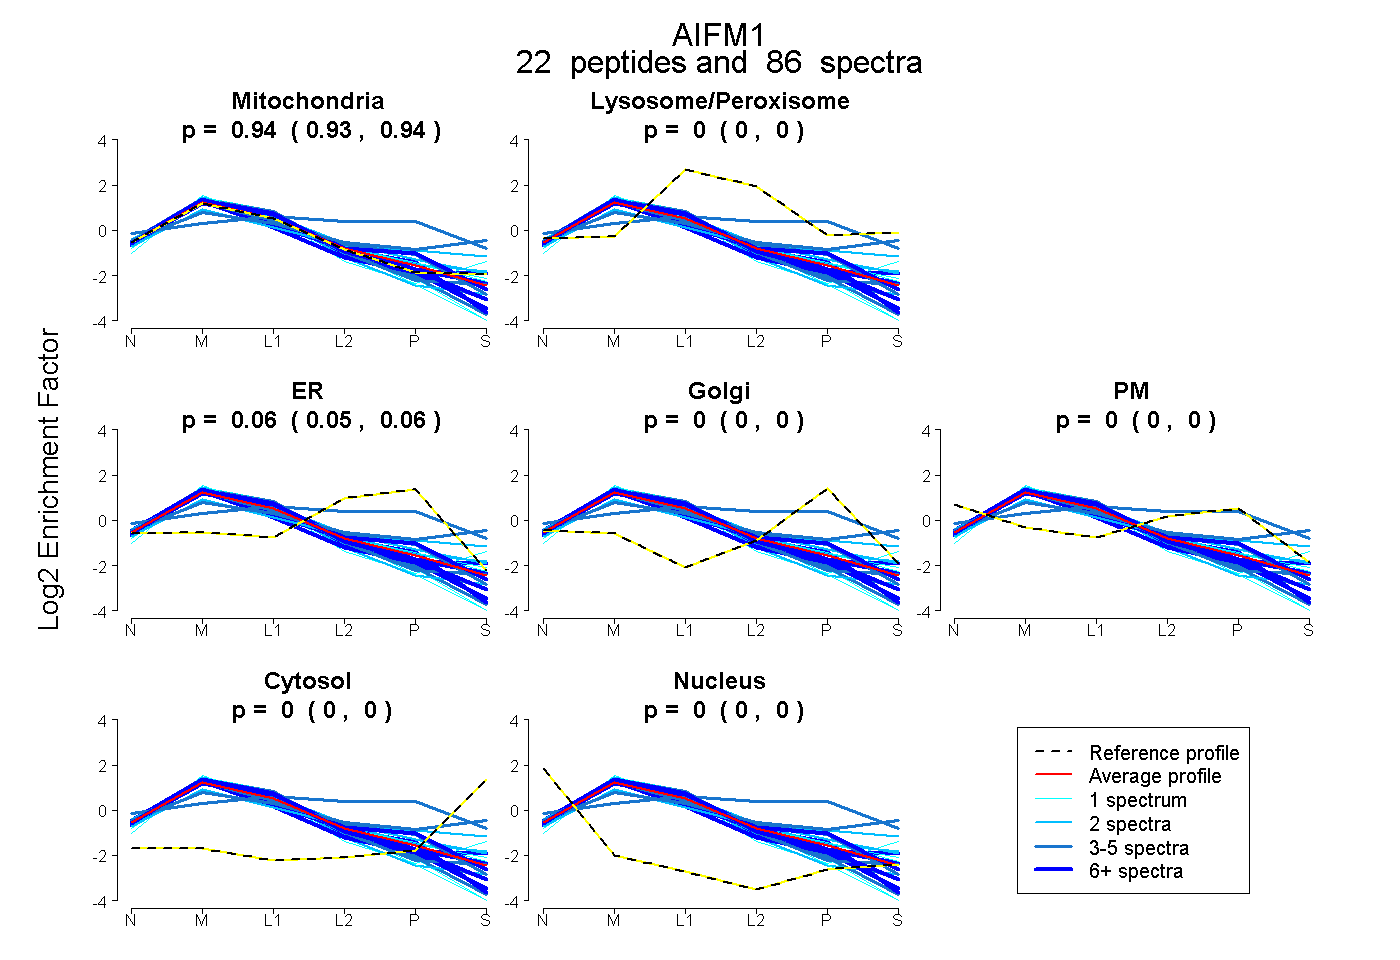 |
0.940 0.934 | 0.945 |
0.000 0.000 | 0.000 |
0.060 0.054 | 0.065 |
0.000 0.000 | 0.000 |
0.000 0.000 | 0.000 |
0.000 0.000 | 0.000 |
0.000 0.000 | 0.000 |
|||
| Plot | Lyso | Other | |||||||||||
| Expt C |
26 peptides |
614 spectra |
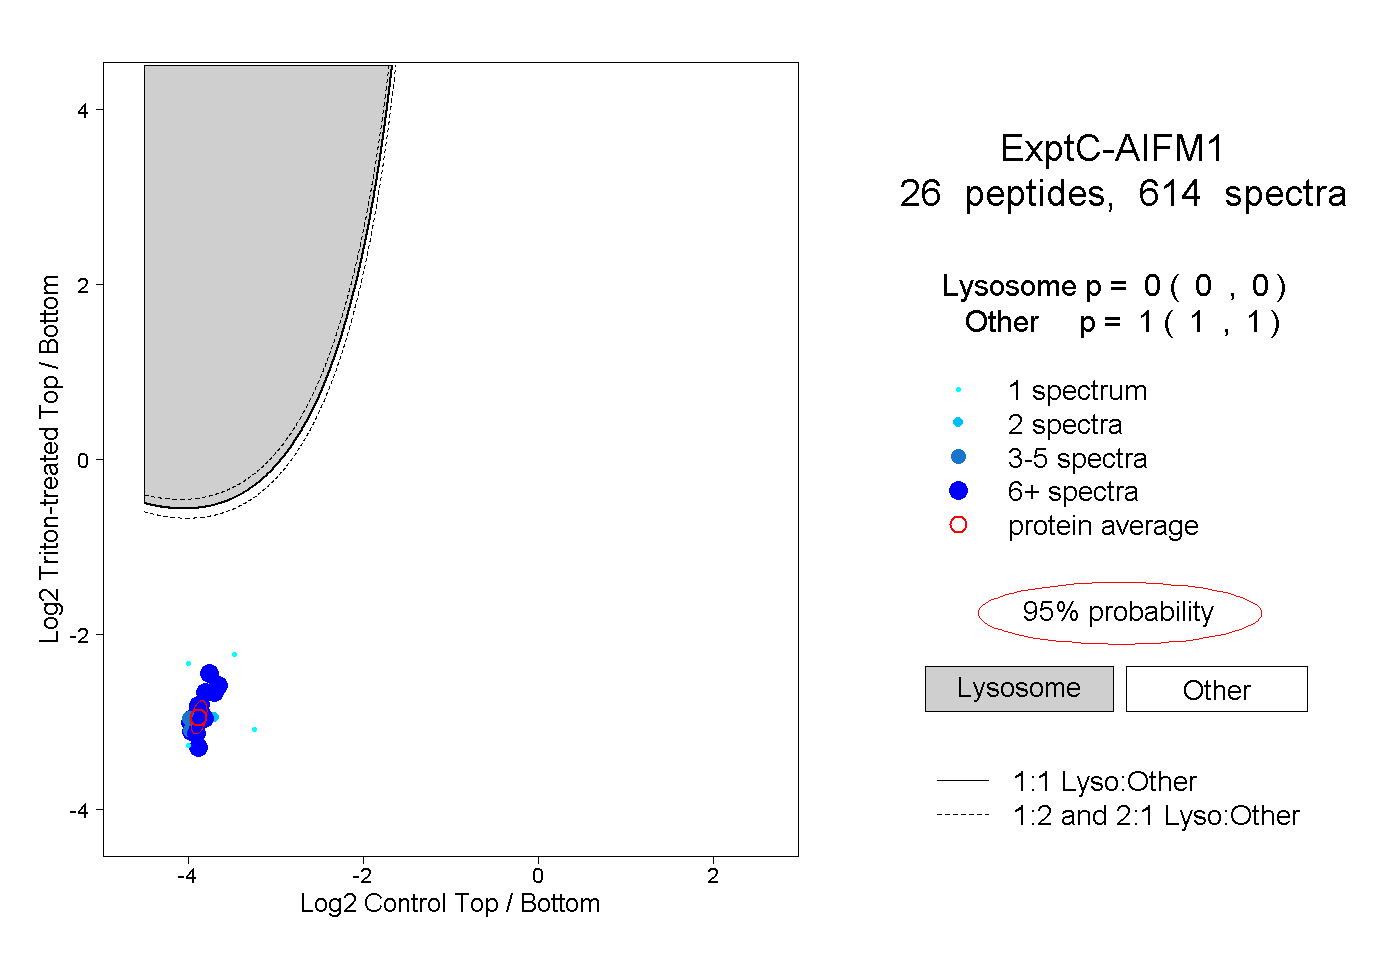 |
0.000 0.000 | 0.000 |
1.000 1.000 | 1.000 |
||||||||
| Plot | Lyso | Other | |||||||||||
| Expt D |
15 peptides |
45 spectra |
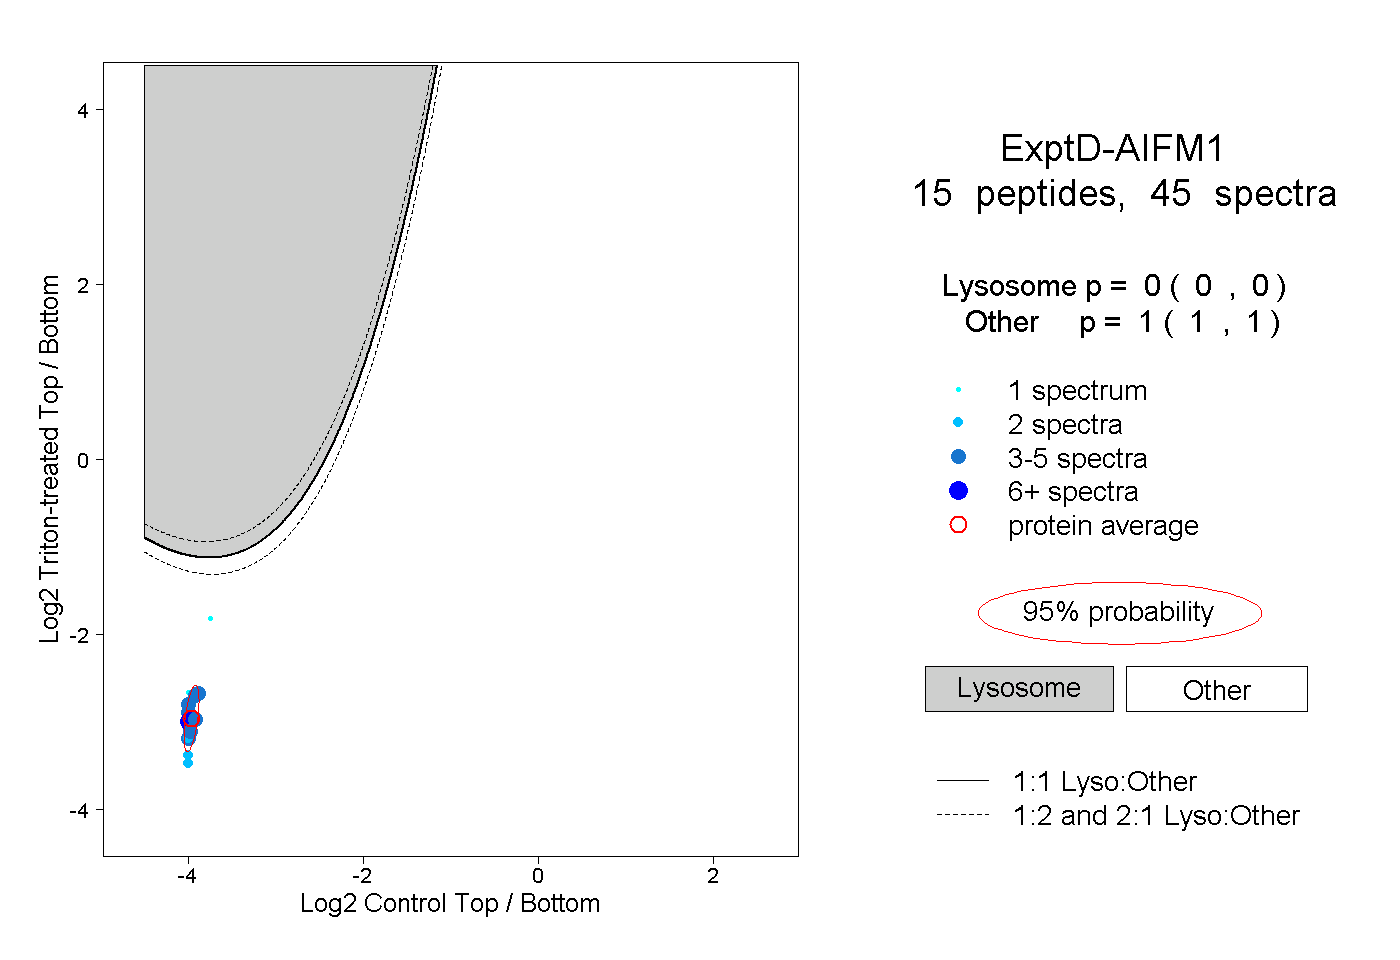 |
0.000 0.000 | 0.000 |
1.000 1.000 | 1.000 |