30
30peptides
spectra
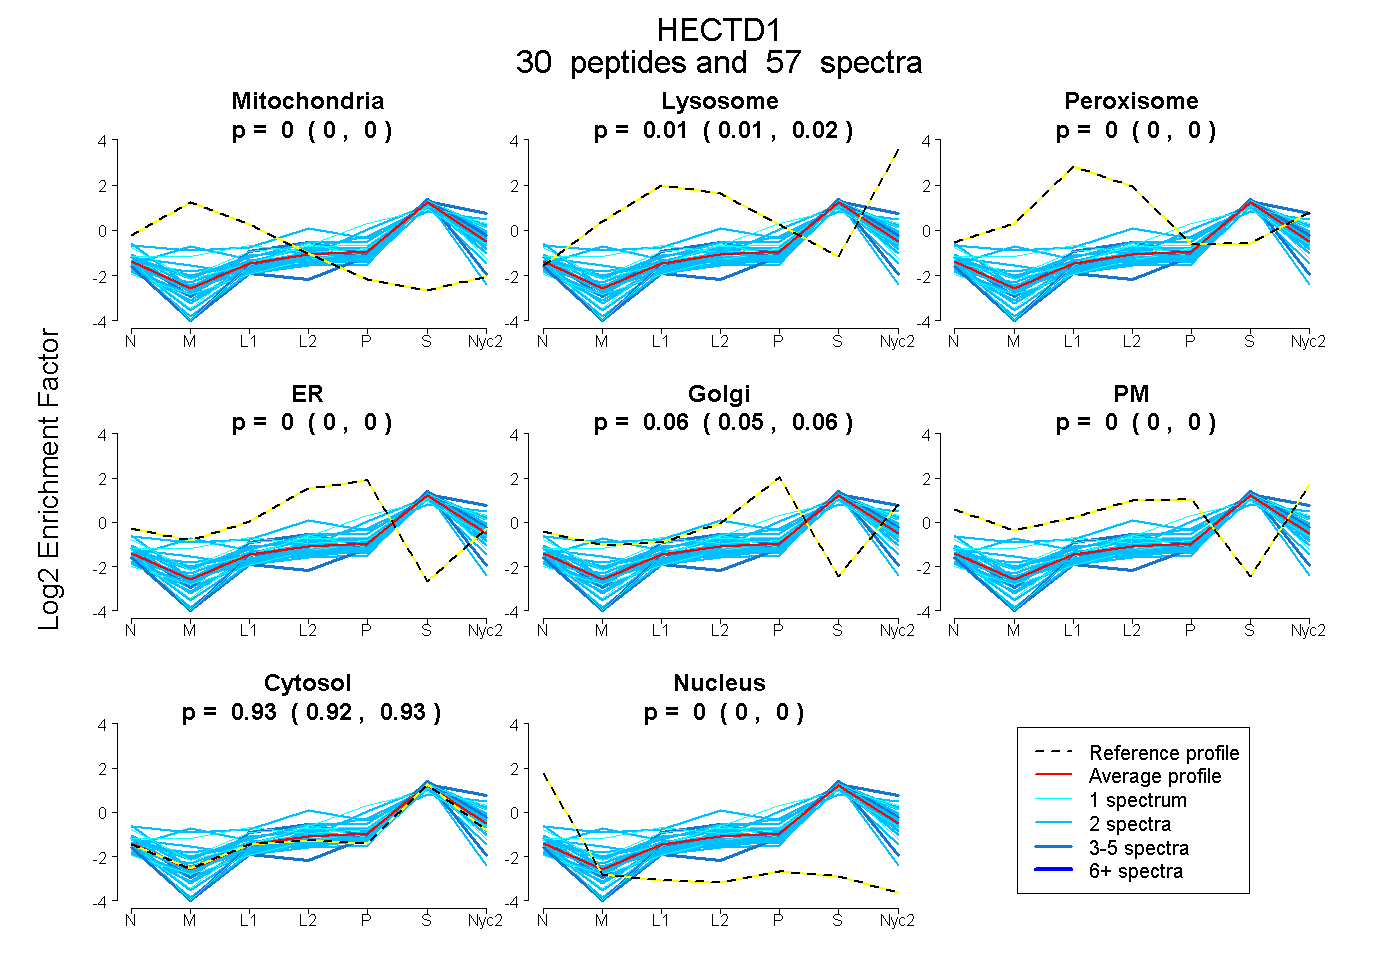
0.000 | 0.000
0.009 | 0.018
0.000 | 0.000
0.000 | 0.000
0.054 | 0.062
0.000 | 0.000
0.924 | 0.931
0.000 | 0.000
11peptides
spectra
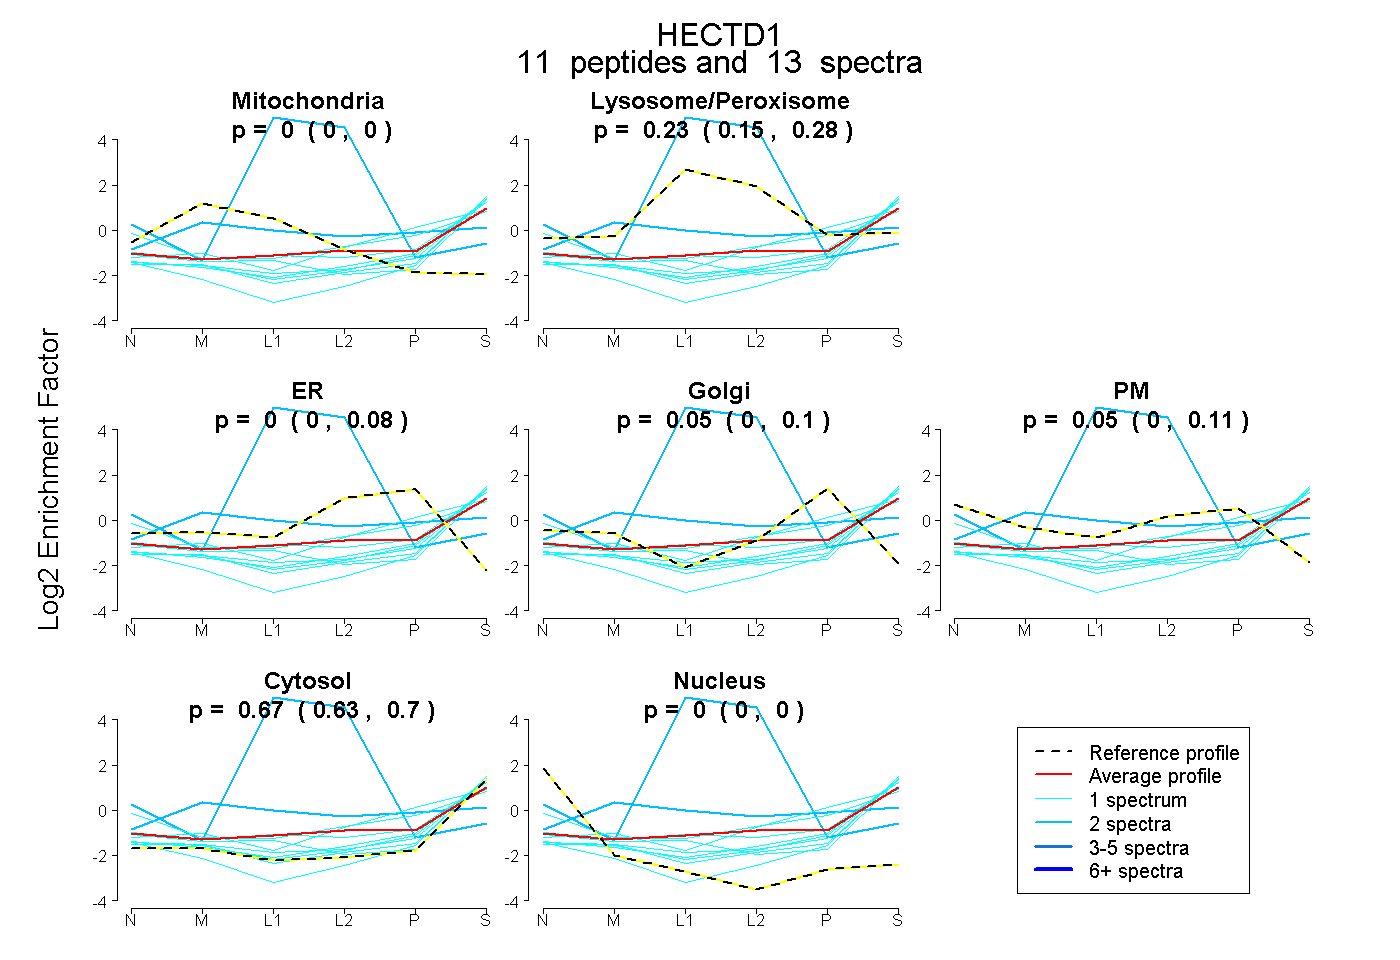
0.000 | 0.000
0.153 | 0.282
0.000 | 0.077
0.000 | 0.096
0.000 | 0.115
0.634 | 0.698
0.000 | 0.000
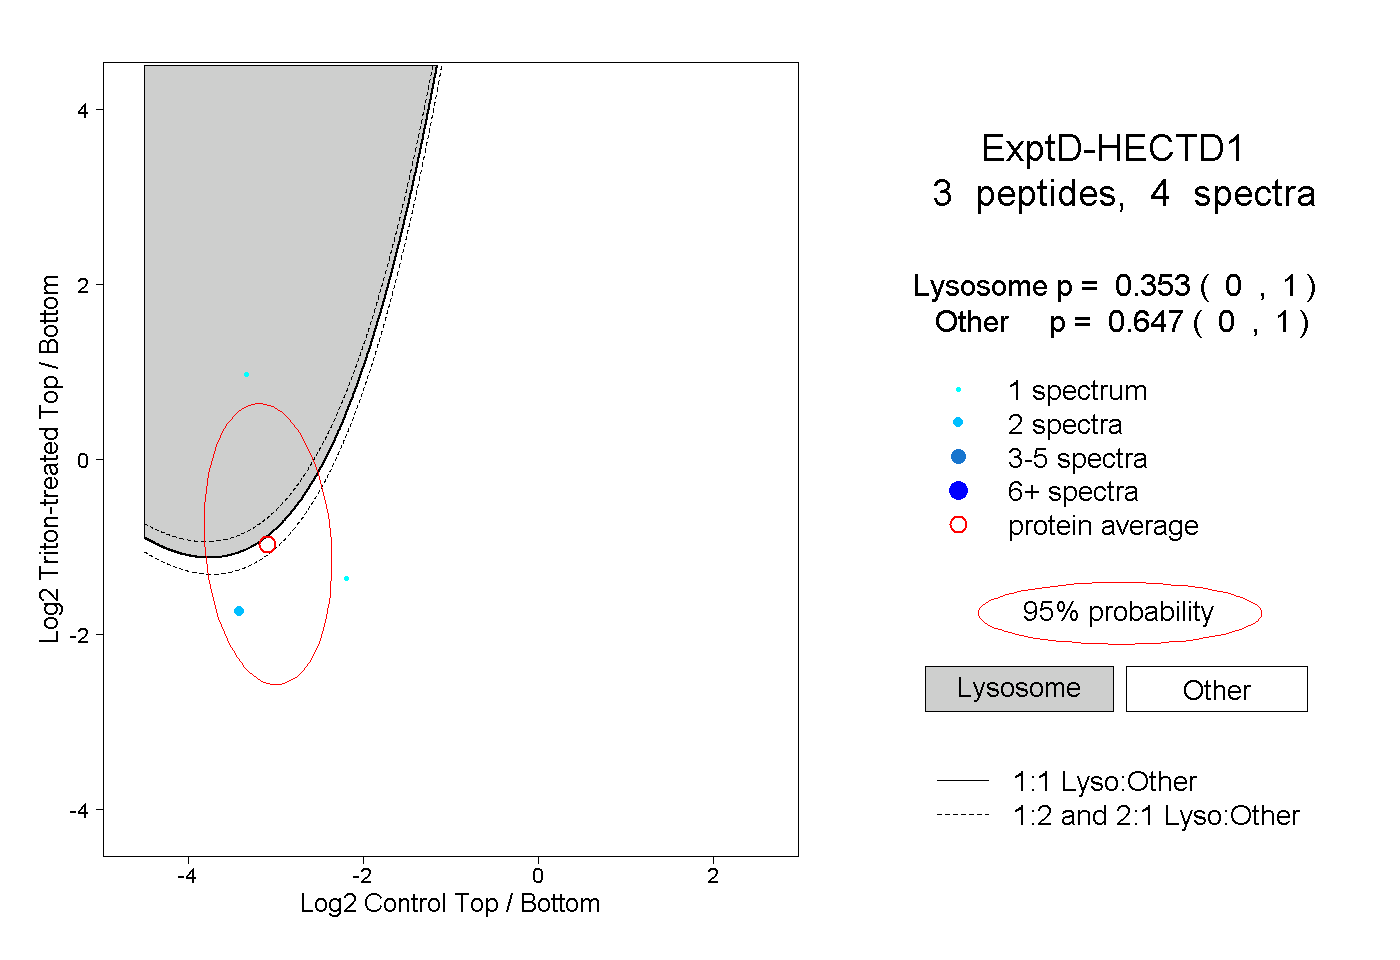
18peptides
spectra
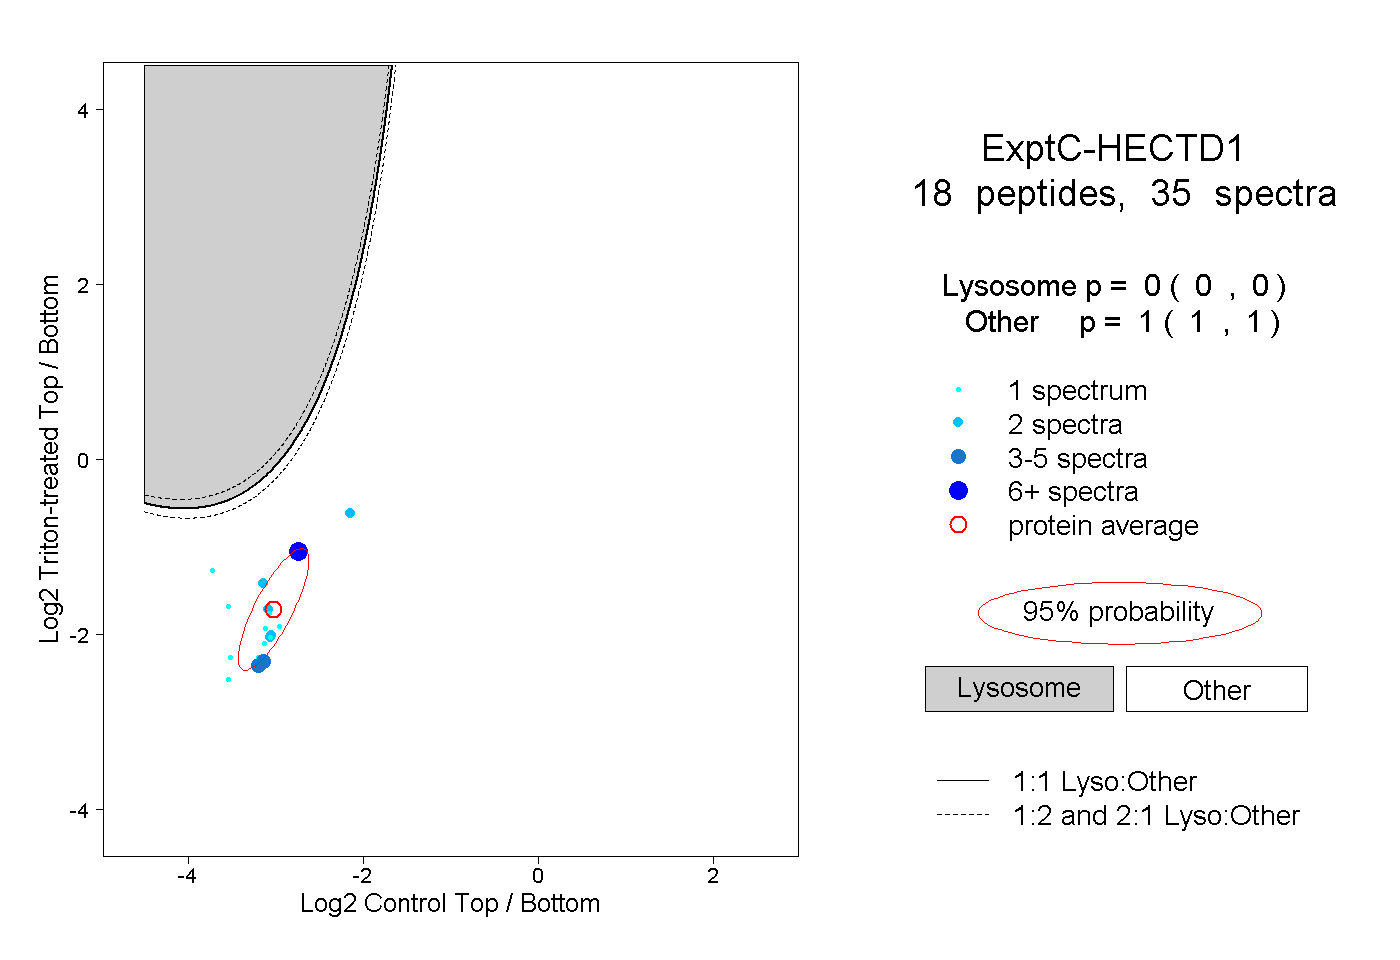
0.000 | 0.000
1.000 | 1.000