HECTD1
[ENSRNOP00000008459]
Main page
| | | Plot |
Mito |
Lyso |
|
Perox |
ER |
Golgi |
PM |
Cytosol |
Nucleus |
|
| Expt A |
 30
30
peptides |
57
spectra |
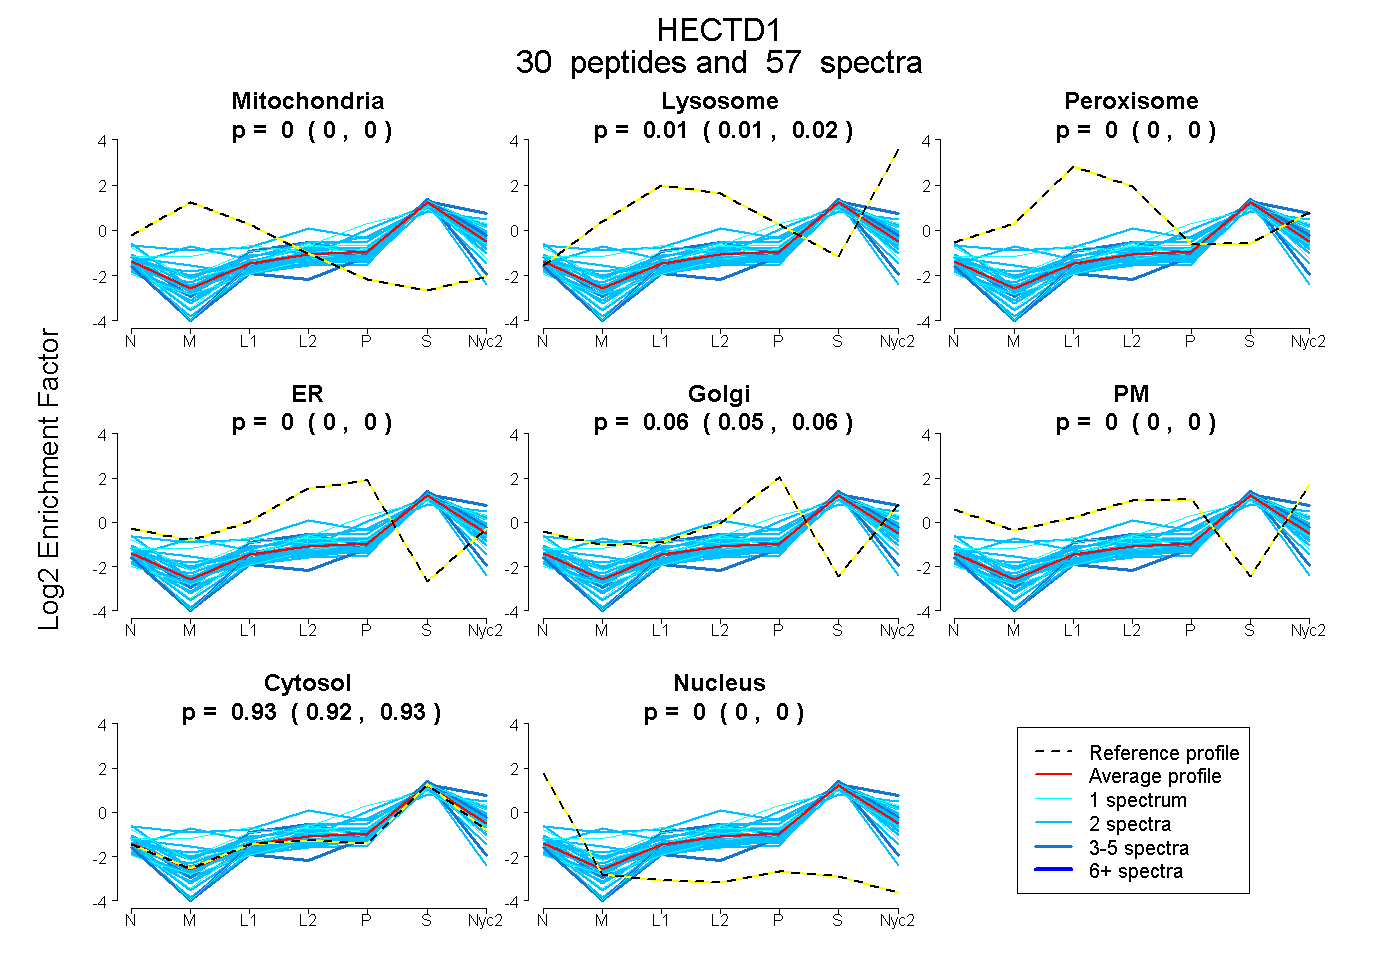 |
0.000
0.000 | 0.000 |
0.014
0.009 | 0.018 |
|
0.000
0.000 | 0.000 |
0.000
0.000 | 0.000 |
0.058
0.054 | 0.062 |
0.000
0.000 | 0.000 |
0.928
0.924 | 0.931 |
0.000
0.000 | 0.000 |
|
| | | Plot |
Mito |
|
Lyso or Perox |
|
ER |
Golgi |
PM |
Cytosol |
Nucleus |
|
| Expt B |
11
peptides |
13
spectra |
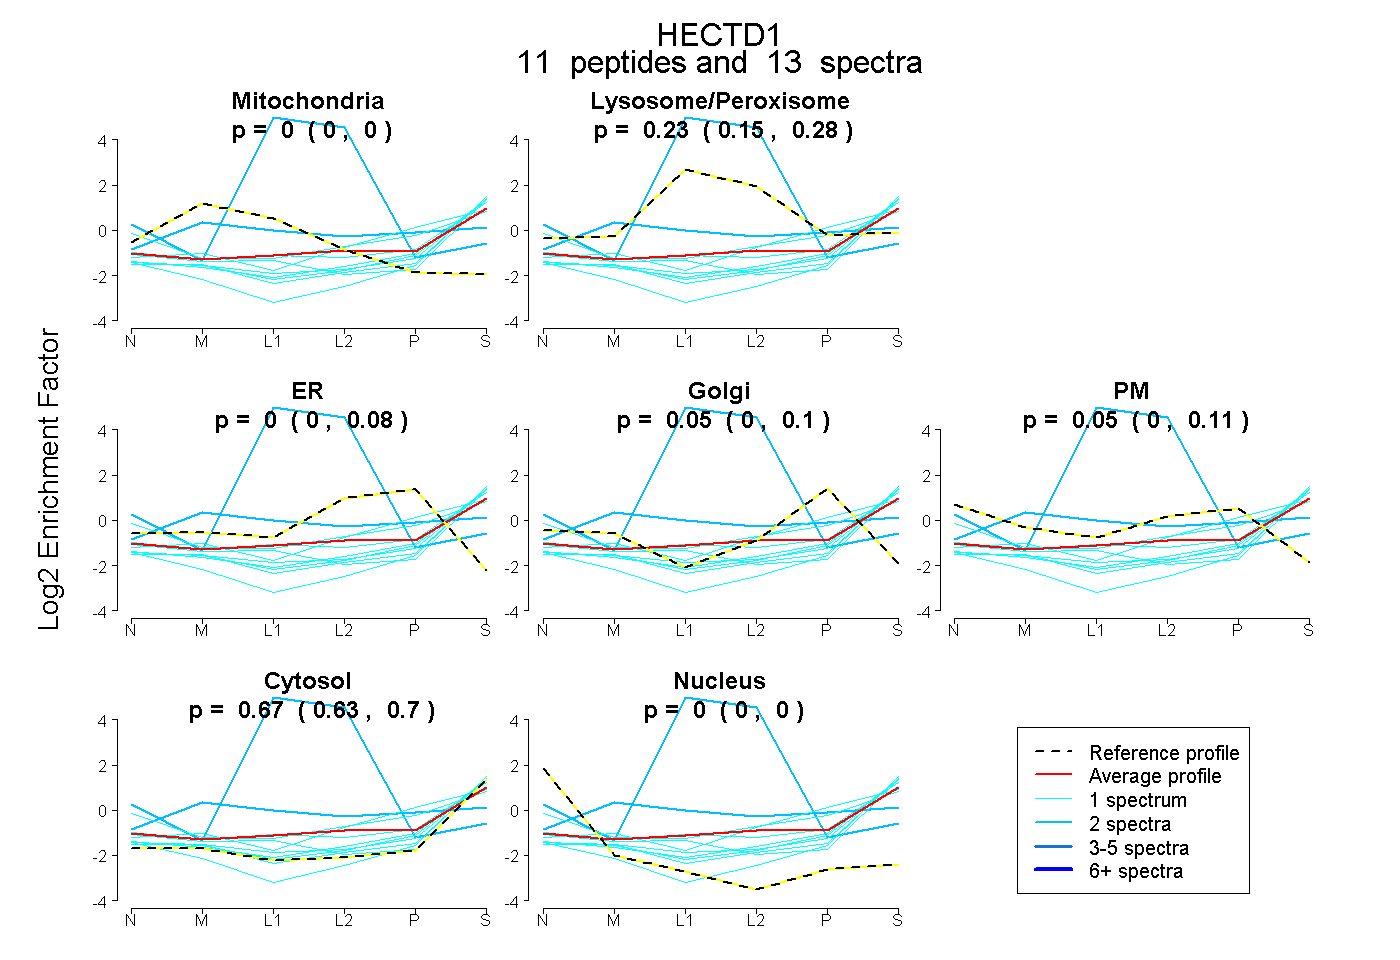 |
0.000
0.000 | 0.000 |
|
0.230
0.153 | 0.282 |
|
0.000
0.000 | 0.077 |
0.053
0.000 | 0.096 |
0.050
0.000 | 0.115 |
0.667
0.634 | 0.698 |
0.000
0.000 | 0.000 |
|
| 1 spectrum, SSFVFVR |
0.000 |
|
0.113 |
|
0.088 |
0.235 |
0.000 |
0.564 |
0.000 |
|
| 2 spectra, DDPGEFR |
0.000 |
|
1.000 |
|
0.000 |
0.000 |
0.000 |
0.000 |
0.000 |
|
| 1 spectrum, LQELVLK |
0.000 |
|
0.131 |
|
0.000 |
0.000 |
0.337 |
0.533 |
0.000 |
|
| 1 spectrum, APGETALIDR |
0.000 |
|
0.000 |
|
0.000 |
0.048 |
0.010 |
0.942 |
0.000 |
|
| 1 spectrum, ETSSLESFVR |
0.000 |
|
0.221 |
|
0.000 |
0.062 |
0.010 |
0.707 |
0.000 |
|
| 1 spectrum, LIAVLESIER |
0.000 |
|
0.000 |
|
0.000 |
0.000 |
0.000 |
0.950 |
0.050 |
|
| 1 spectrum, VTGLGTTR |
0.000 |
|
0.052 |
|
0.000 |
0.103 |
0.000 |
0.845 |
0.000 |
|
| 1 spectrum, LEDILSR |
0.000 |
|
0.022 |
|
0.000 |
0.100 |
0.000 |
0.879 |
0.000 |
|
| 1 spectrum, QLIDCIR |
0.000 |
|
0.127 |
|
0.000 |
0.000 |
0.000 |
0.820 |
0.054 |
|
| 1 spectrum, EGQNFIFR |
0.000 |
|
0.072 |
|
0.000 |
0.048 |
0.000 |
0.880 |
0.000 |
|
| 2 spectra, LLYESR |
0.160 |
|
0.365 |
|
0.000 |
0.226 |
0.000 |
0.250 |
0.000 |
|
| | | Plot |
|
Lyso |
|
|
|
|
|
|
|
Other |
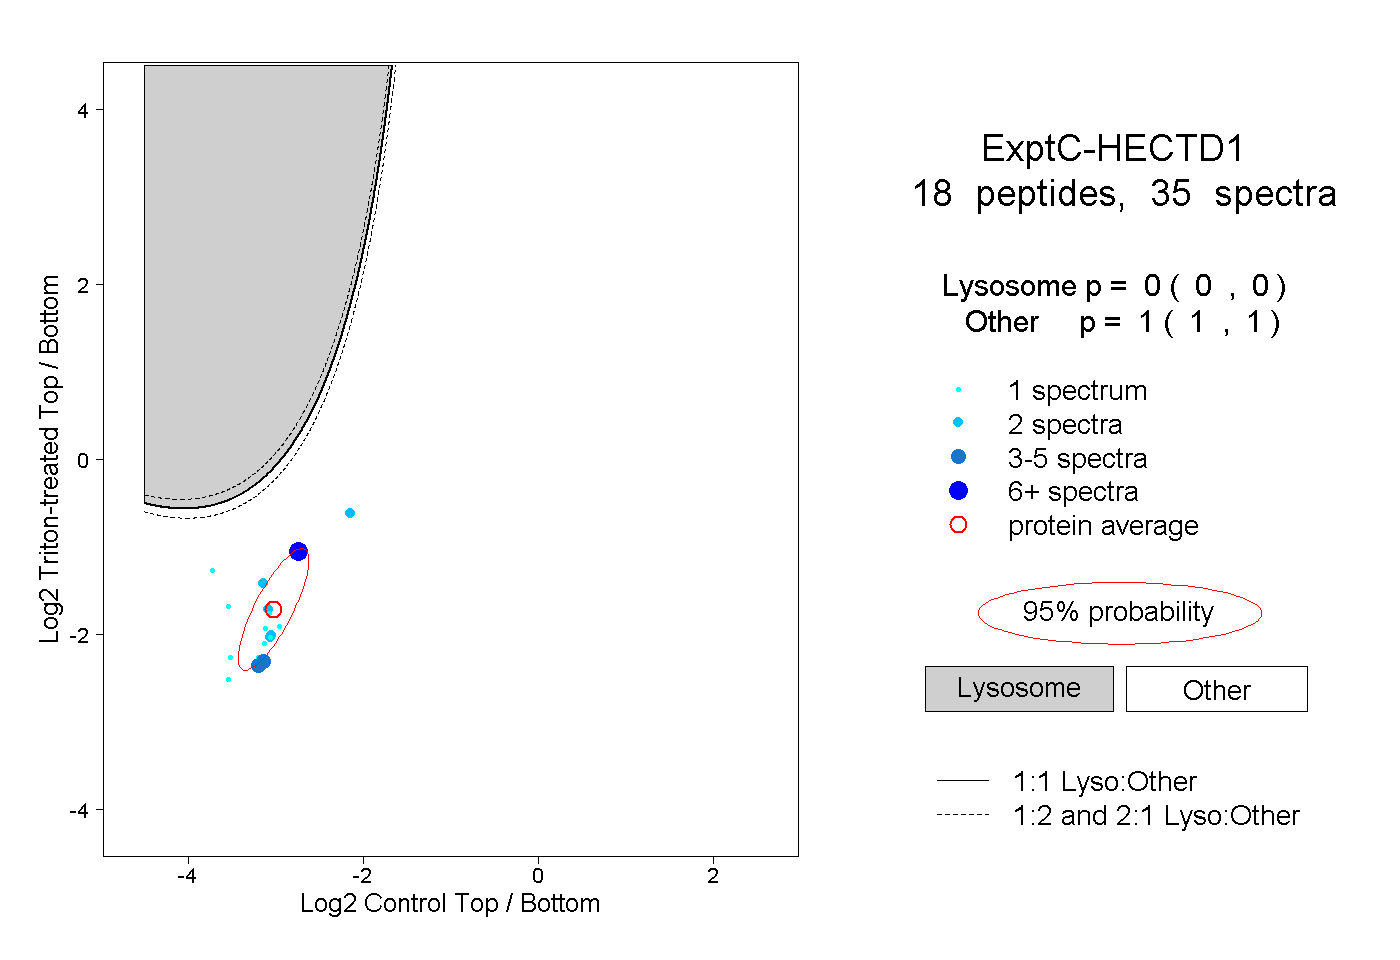
| Expt C |
18
peptides |
35
spectra |
 |
|
0.000
0.000 | 0.000 |
|
|
|
|
|
|
|
1.000
1.000 | 1.000 |
| | | Plot |
|
Lyso |
|
|
|
|
|
|
|
Other |
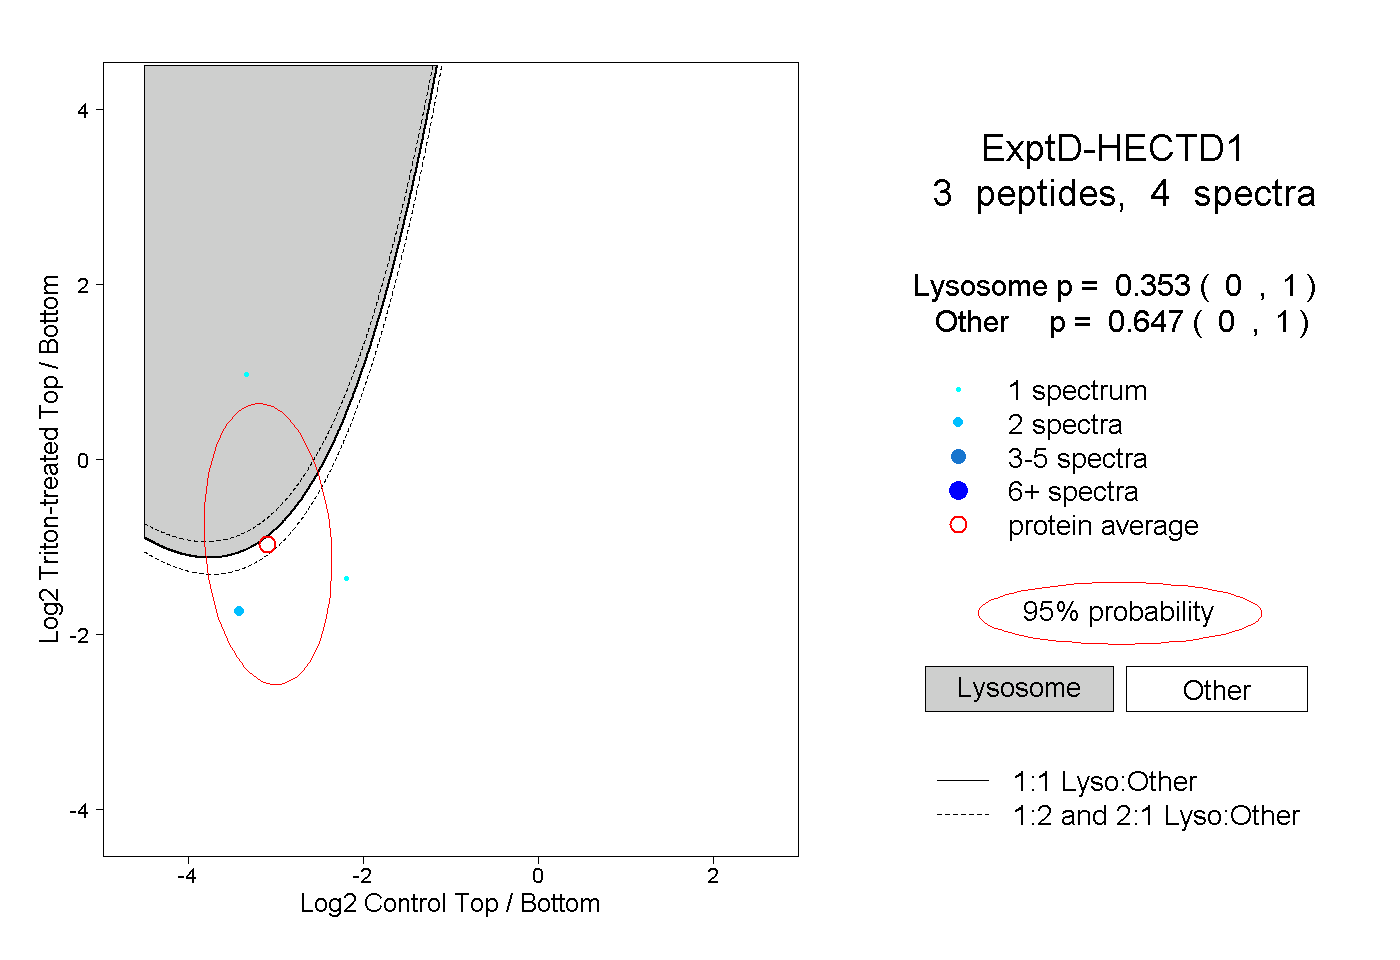
| Expt D |
3
peptides |
4
spectra |
 |
|
0.353
0.000 | 1.000 |
|
|
|
|
|
|
|
0.647
0.000 | 1.000 |