 10
10peptides
spectra
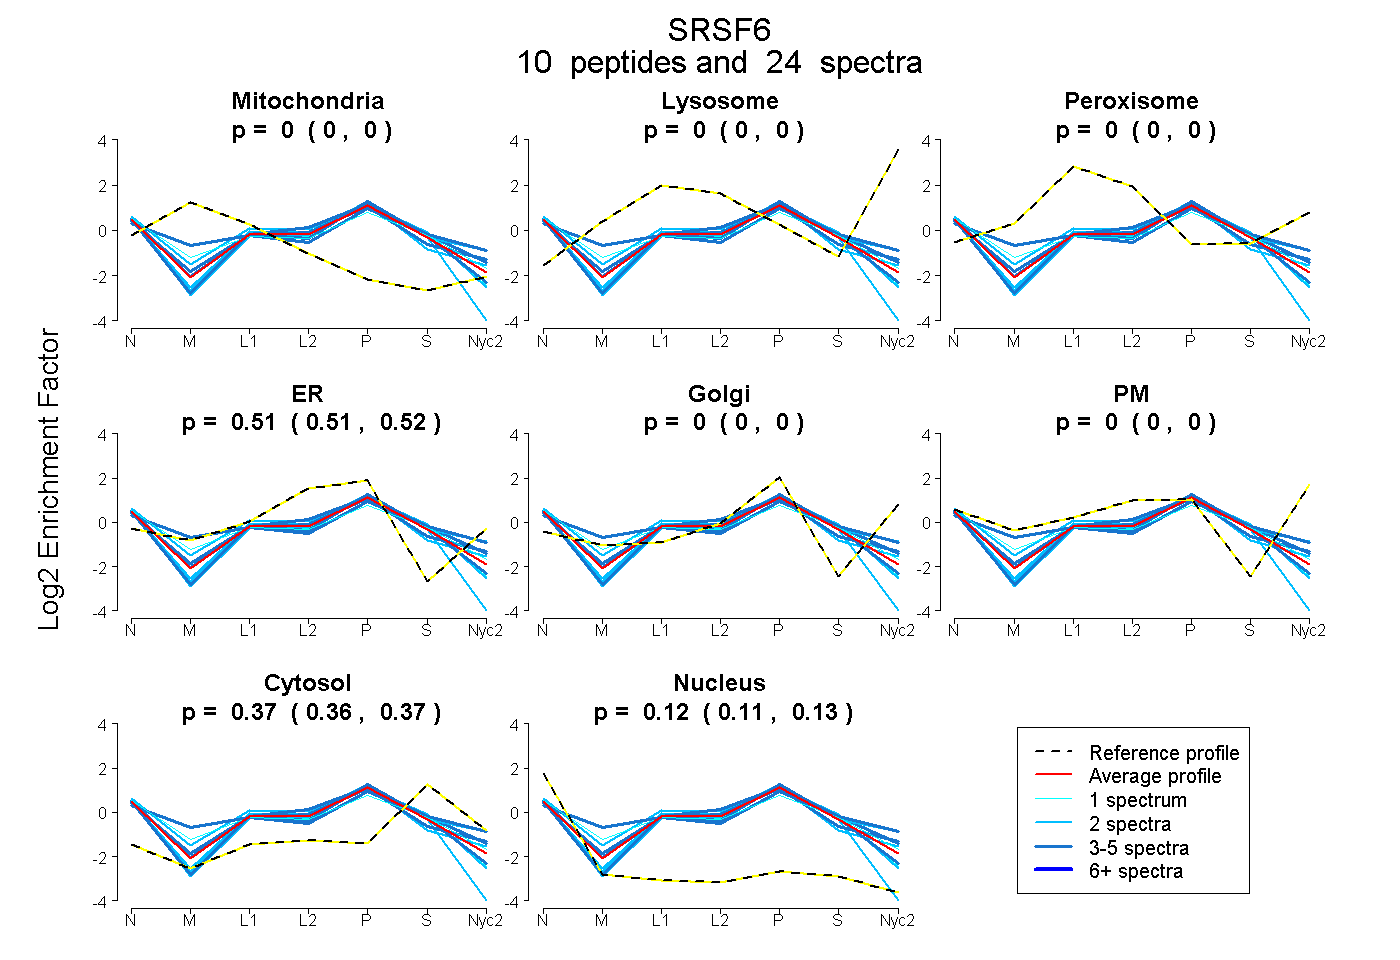
0.000 | 0.000
0.000 | 0.000
0.000 | 0.000
0.508 | 0.520
0.000 | 0.000
0.000 | 0.000
0.358 | 0.373
0.111 | 0.127
3peptides
spectra
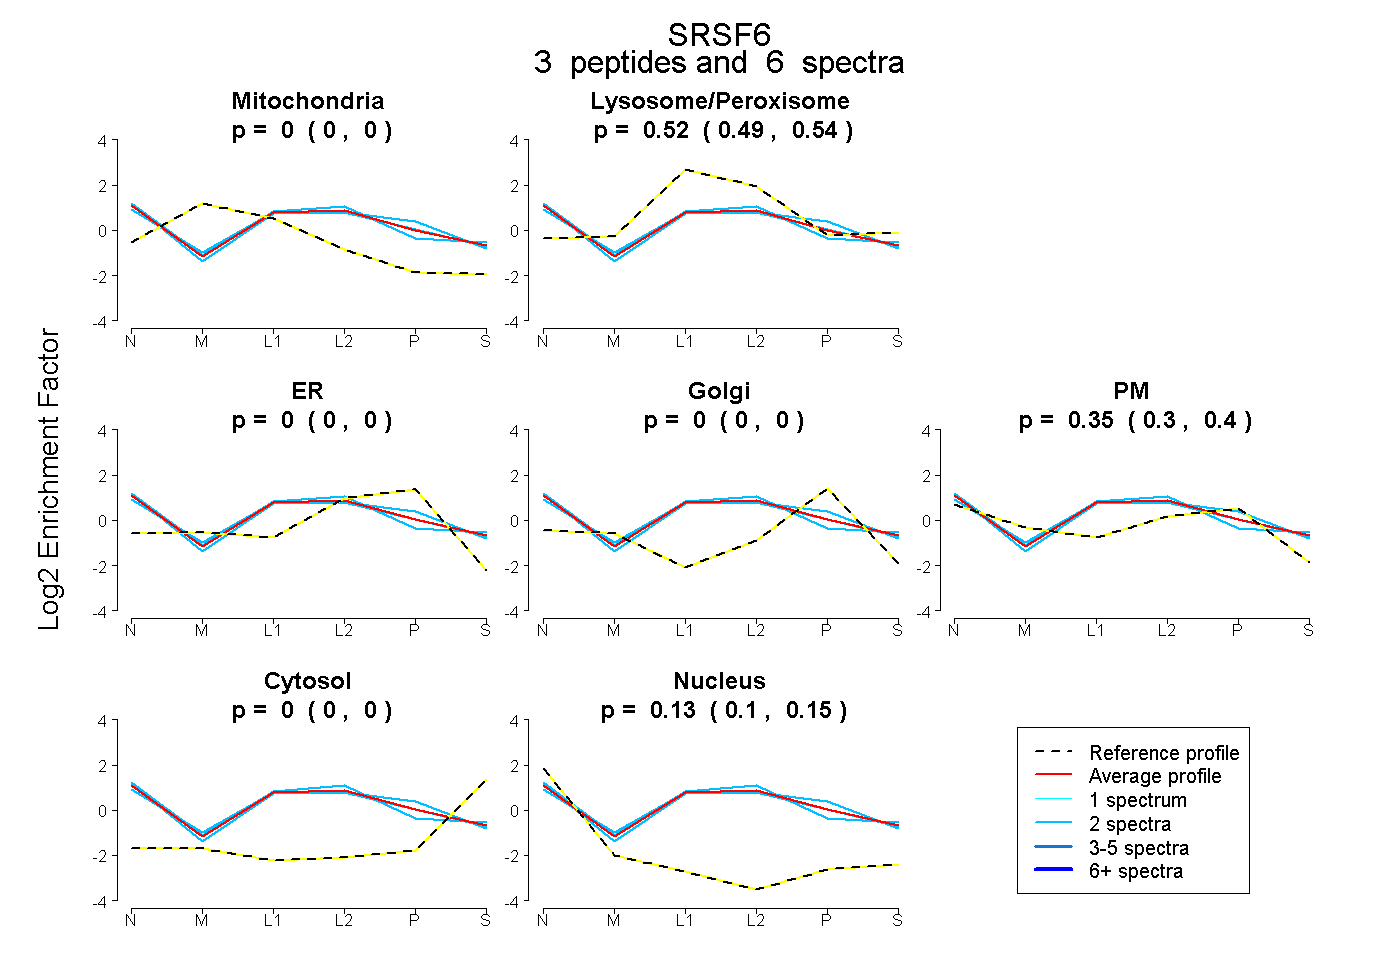
0.000 | 0.000
0.493 | 0.541
0.000 | 0.000
0.000 | 0.000
0.302 | 0.401
0.000 | 0.000
0.097 | 0.151
11peptides
spectra
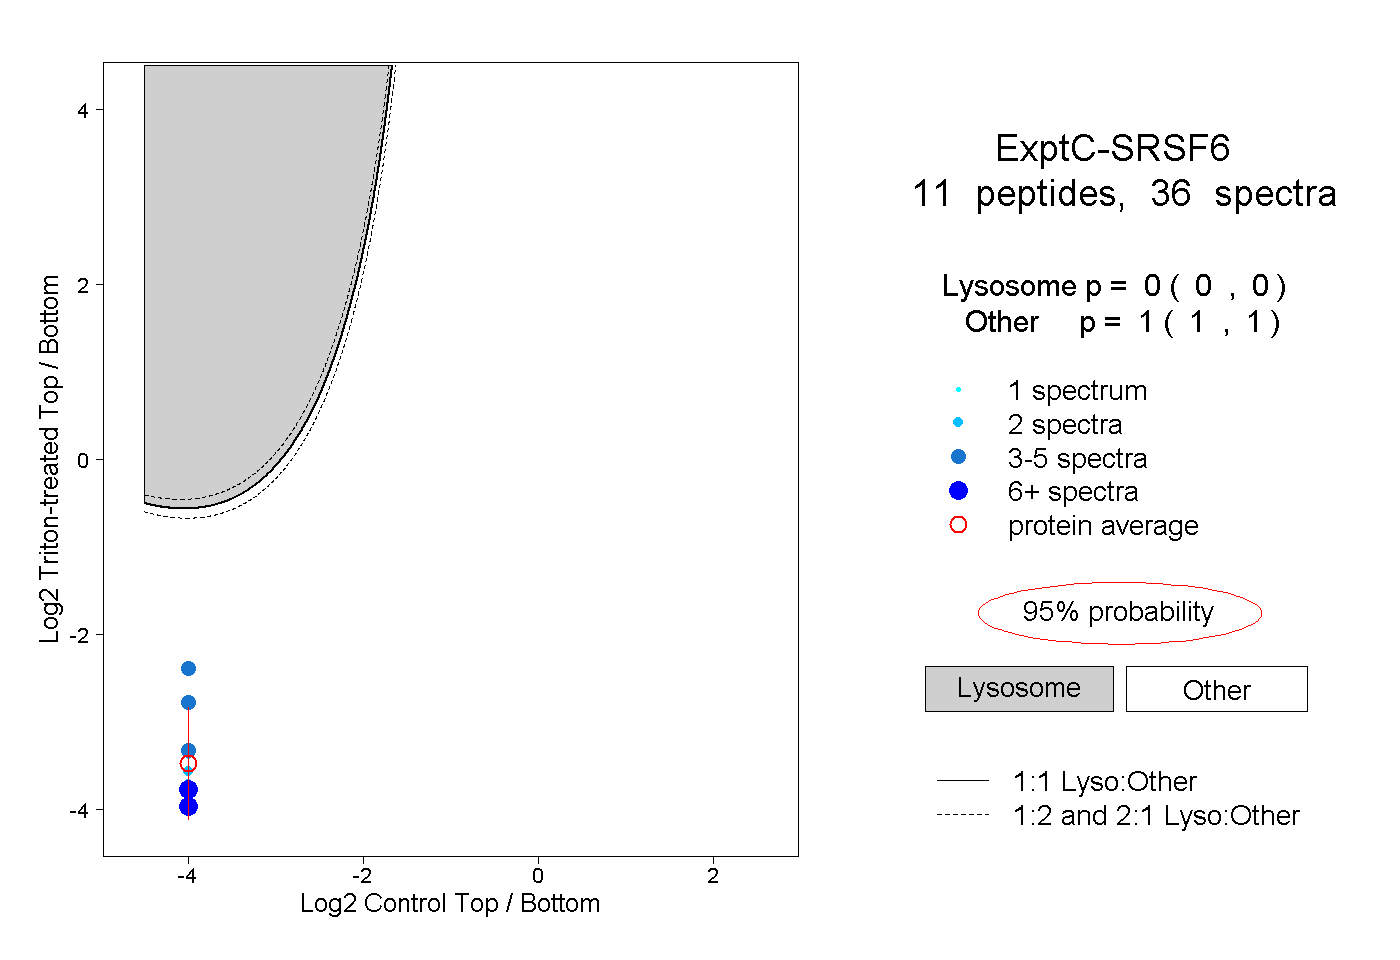
0.000 | 0.000
1.000 | 1.000
2peptides
spectra
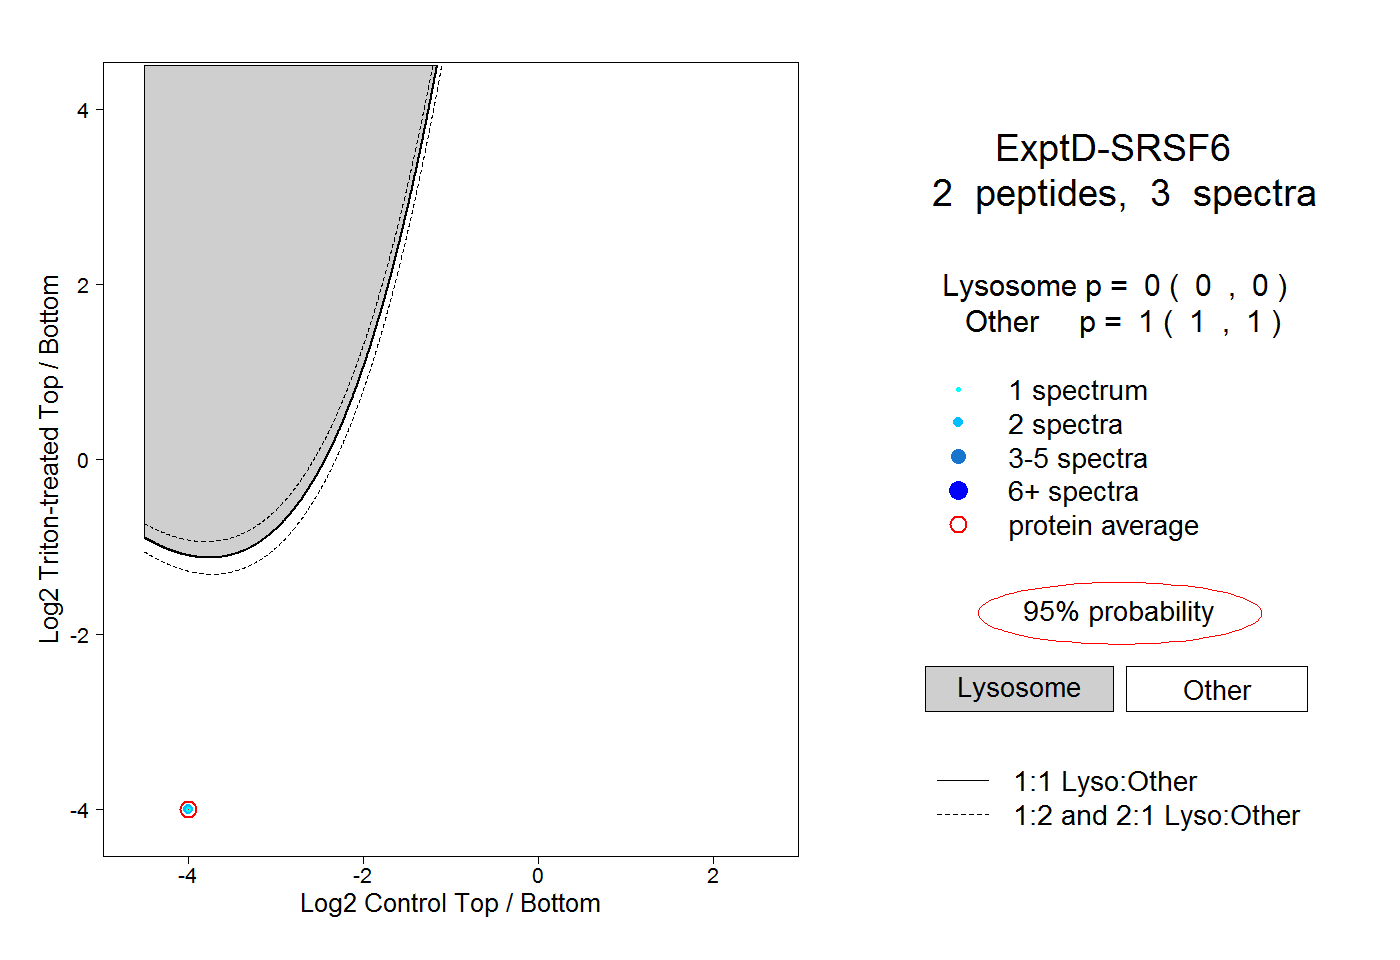
0.000 | 0.000
1.000 | 1.000