 9
9peptides
spectra
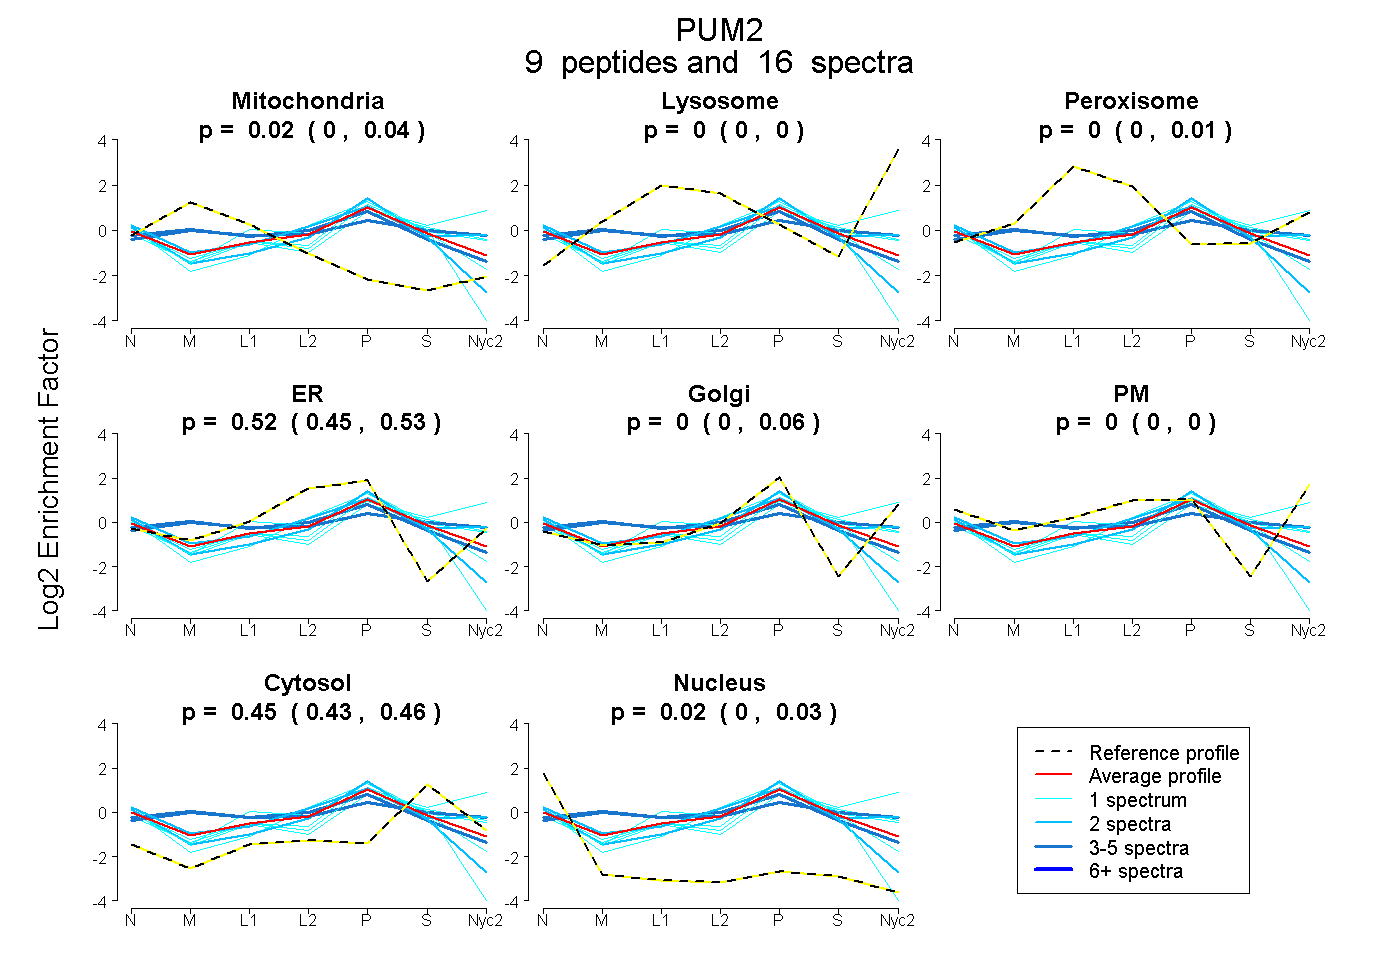
0.000 | 0.038
0.000 | 0.000
0.000 | 0.011
0.448 | 0.527
0.000 | 0.064
0.000 | 0.000
0.433 | 0.455
0.000 | 0.029
| Plot | Mito | Lyso | Perox | ER | Golgi | PM | Cytosol | Nucleus | |||||
| Expt A |
9 peptides |
16 spectra |
|
0.017 0.000 | 0.038 |
0.000 0.000 | 0.000 |
0.000 0.000 | 0.011 |
0.520 0.448 | 0.527 |
0.000 0.000 | 0.064 |
0.000 0.000 | 0.000 |
0.448 0.433 | 0.455 |
0.015 0.000 | 0.029 |
| 1 spectrum, IRPHITTLR | 0.056 | 0.000 | 0.000 | 0.377 | 0.000 | 0.000 | 0.354 | 0.213 | ||
| 1 spectrum, ASPFEEDQNR | 0.000 | 0.000 | 0.087 | 0.000 | 0.409 | 0.019 | 0.439 | 0.046 | ||
| 4 spectra, DQYANYVVQK | 0.201 | 0.000 | 0.045 | 0.450 | 0.000 | 0.000 | 0.303 | 0.000 | ||
| 1 spectrum, FWEPDDSTK | 0.000 | 0.086 | 0.077 | 0.000 | 0.198 | 0.256 | 0.384 | 0.000 | ||
| 1 spectrum, ALESISSDQQSEMVK | 0.000 | 0.000 | 0.034 | 0.141 | 0.407 | 0.000 | 0.417 | 0.000 | ||
| 1 spectrum, DQNGNHVVQK | 0.000 | 0.000 | 0.000 | 0.510 | 0.000 | 0.000 | 0.420 | 0.070 | ||
| 2 spectra, ELDGHVLK | 0.000 | 0.000 | 0.000 | 0.495 | 0.000 | 0.000 | 0.328 | 0.177 | ||
| 3 spectra, GHVLPLALQMYGCR | 0.109 | 0.000 | 0.252 | 0.000 | 0.330 | 0.000 | 0.310 | 0.000 | ||
| 2 spectra, SDIMPSGR | 0.000 | 0.000 | 0.000 | 0.307 | 0.061 | 0.246 | 0.386 | 0.000 |
| Plot | Lyso | Other | |||||||||||
| Expt D |
1 peptide |
1 spectrum |
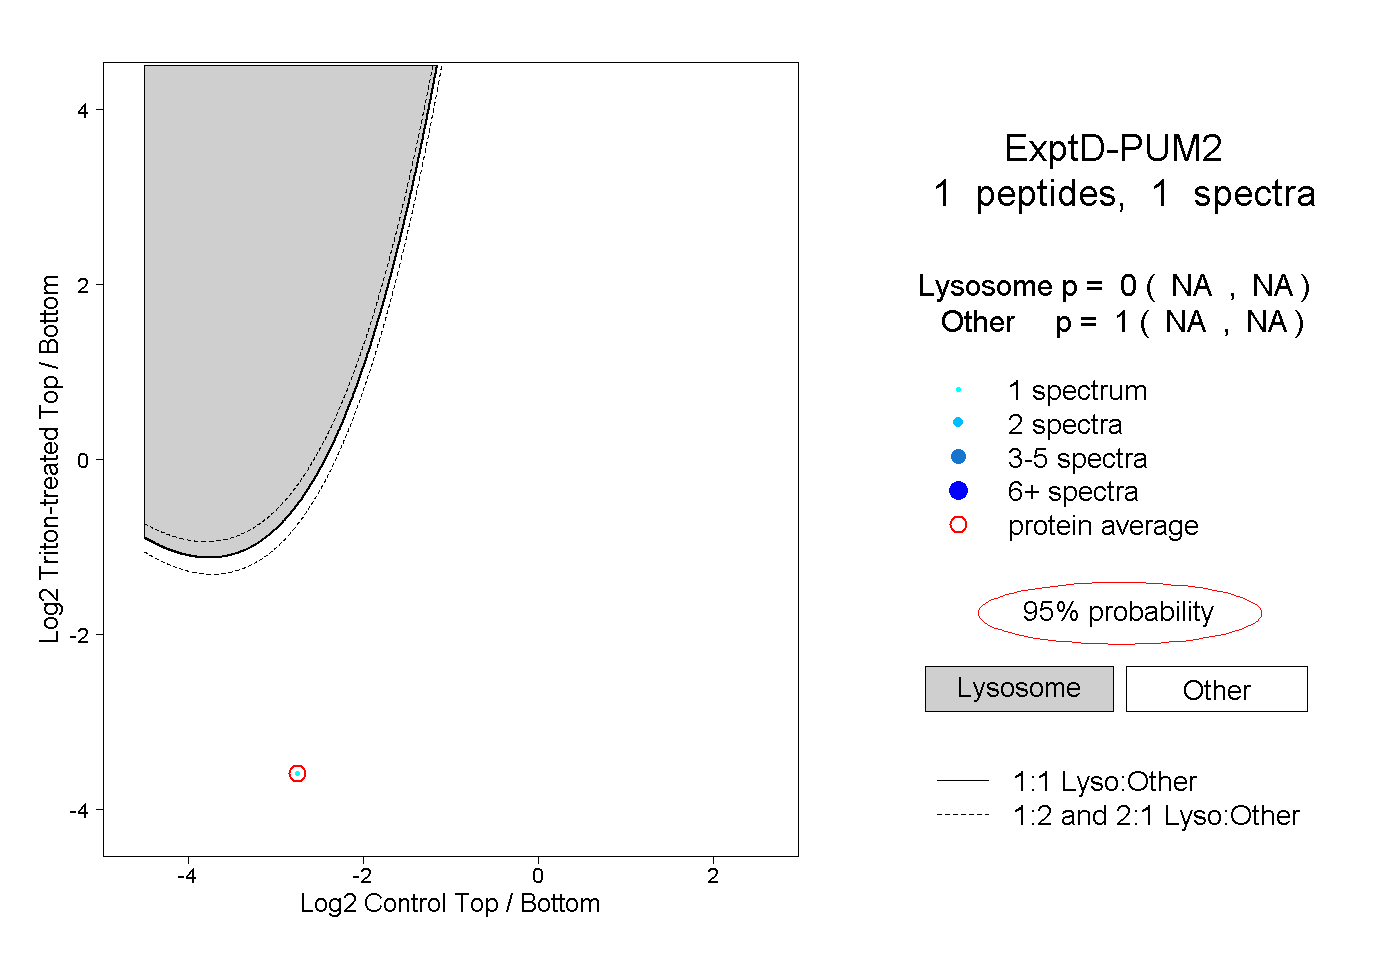 |
0.000 NA | NA |
1.000 NA | NA |