CALU
[ENSRNOP00000008356]
Main page
| | | Plot |
Mito |
Lyso |
|
Perox |
ER |
Golgi |
PM |
Cytosol |
Nucleus |
|
| Expt A |
 9
9
peptides |
33
spectra |
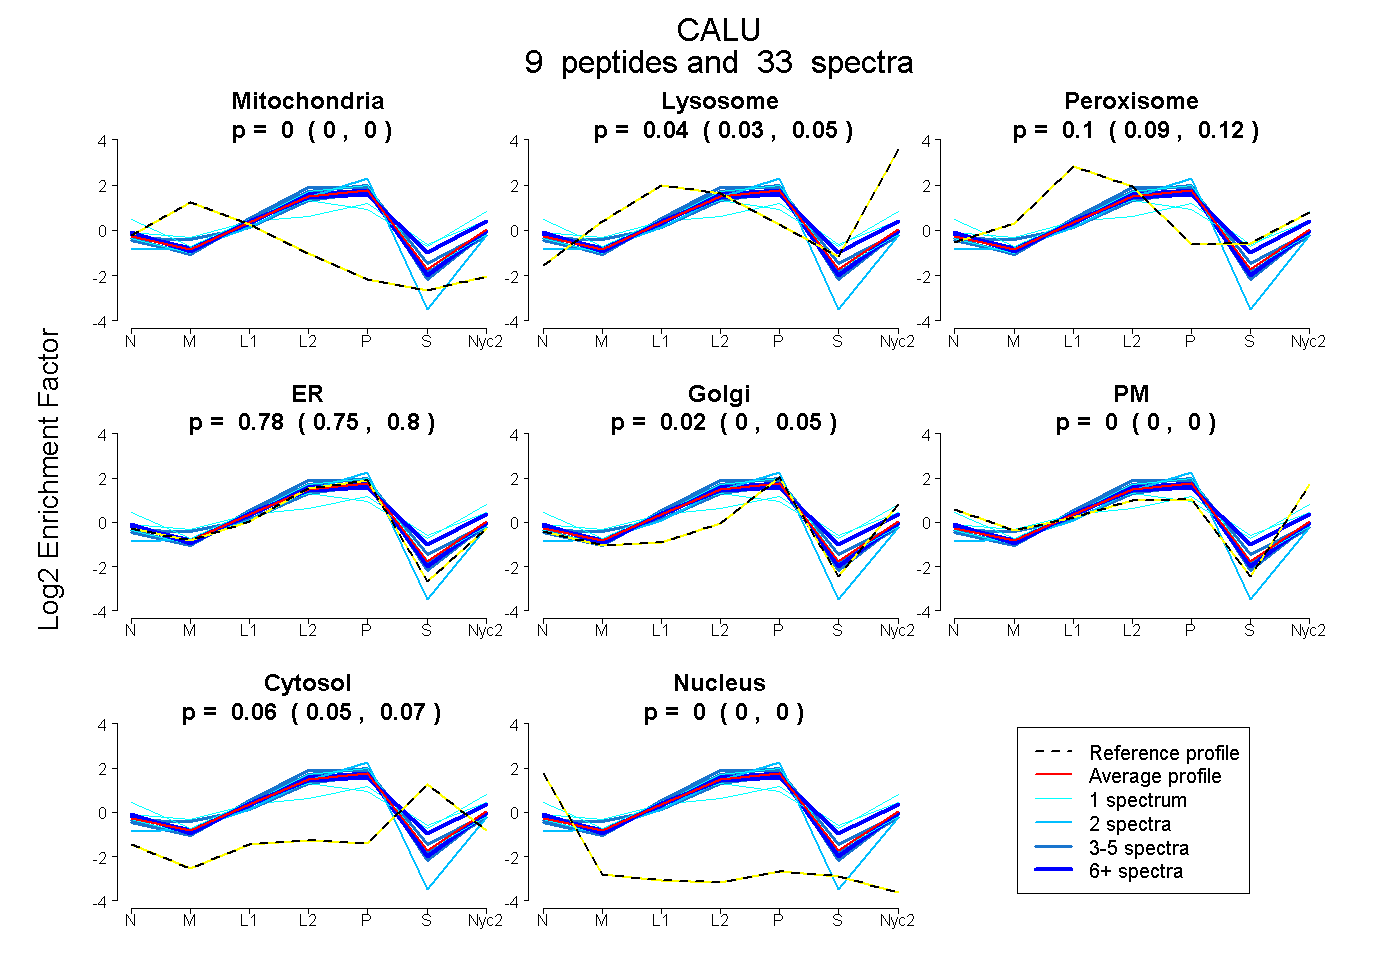 |
0.000
0.000 | 0.000 |
0.043
0.025 | 0.054 |
|
0.100
0.086 | 0.116 |
0.780
0.750 | 0.799 |
0.018
0.000 | 0.045 |
0.000
0.000 | 0.000 |
0.059
0.048 | 0.067 |
0.000
0.000 | 0.000 |
|
| | | Plot |
Mito |
|
Lyso or Perox |
|
ER |
Golgi |
PM |
Cytosol |
Nucleus |
|
| Expt B |
2
peptides |
5
spectra |
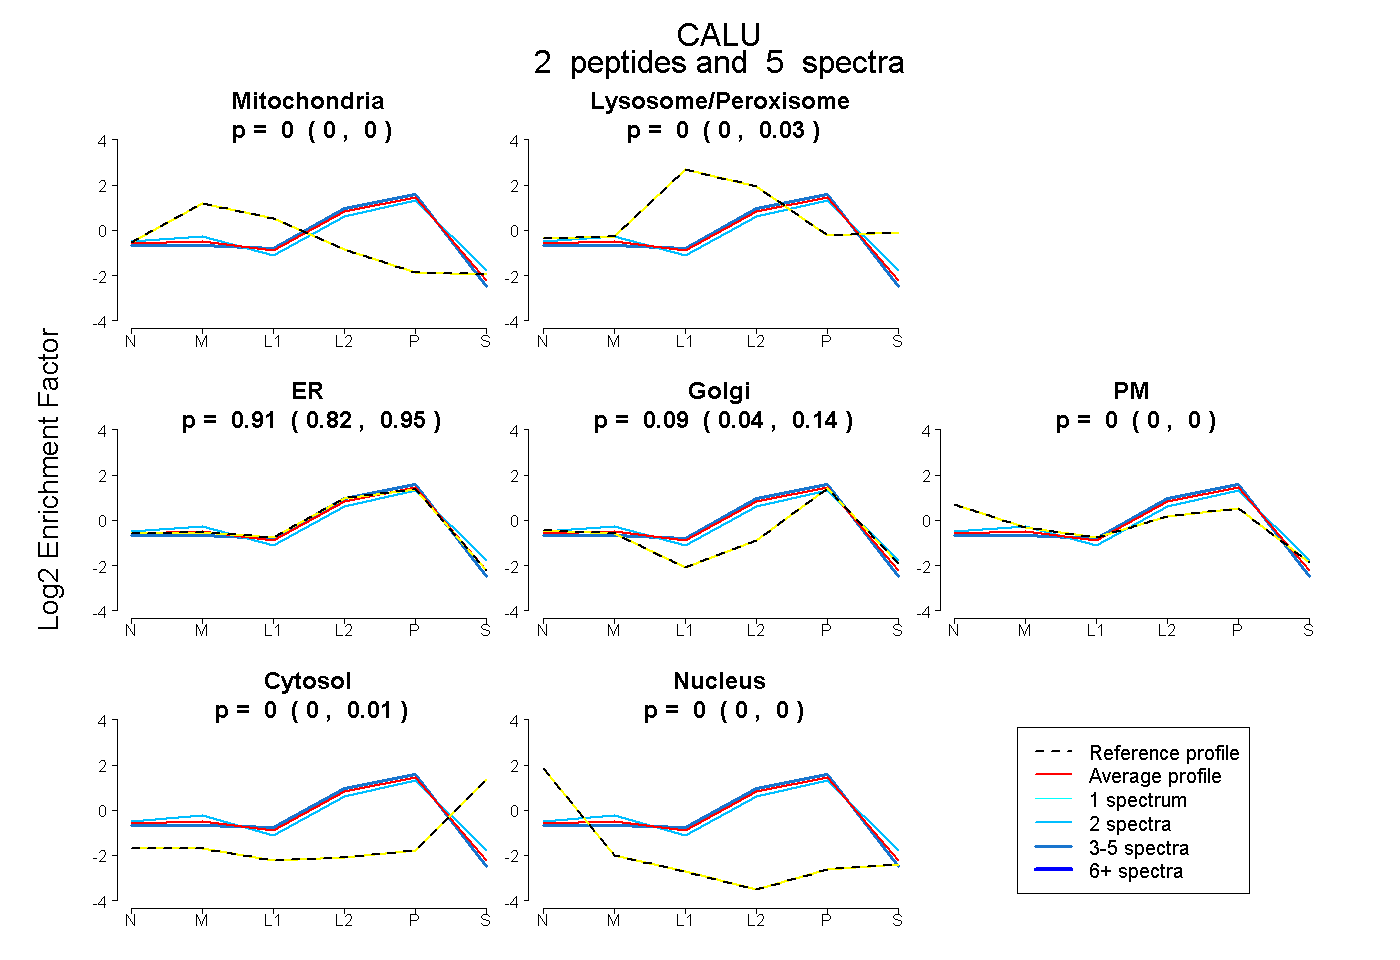 |
0.000
0.000 | 0.000 |
|
0.000
0.000 | 0.027 |
|
0.906
0.822 | 0.946 |
0.094
0.039 | 0.141 |
0.000
0.000 | 0.000 |
0.000
0.000 | 0.007 |
0.000
0.000 | 0.000 |
|
| 2 spectra, WIHEDVER |
0.000 |
|
0.059 |
|
0.621 |
0.286 |
0.029 |
0.005 |
0.000 |
|
| 3 spectra, EQFVEFR |
0.000 |
|
0.000 |
|
1.000 |
0.000 |
0.000 |
0.000 |
0.000 |
|
| | | Plot |
|
Lyso |
|
|
|
|
|
|
|
Other |
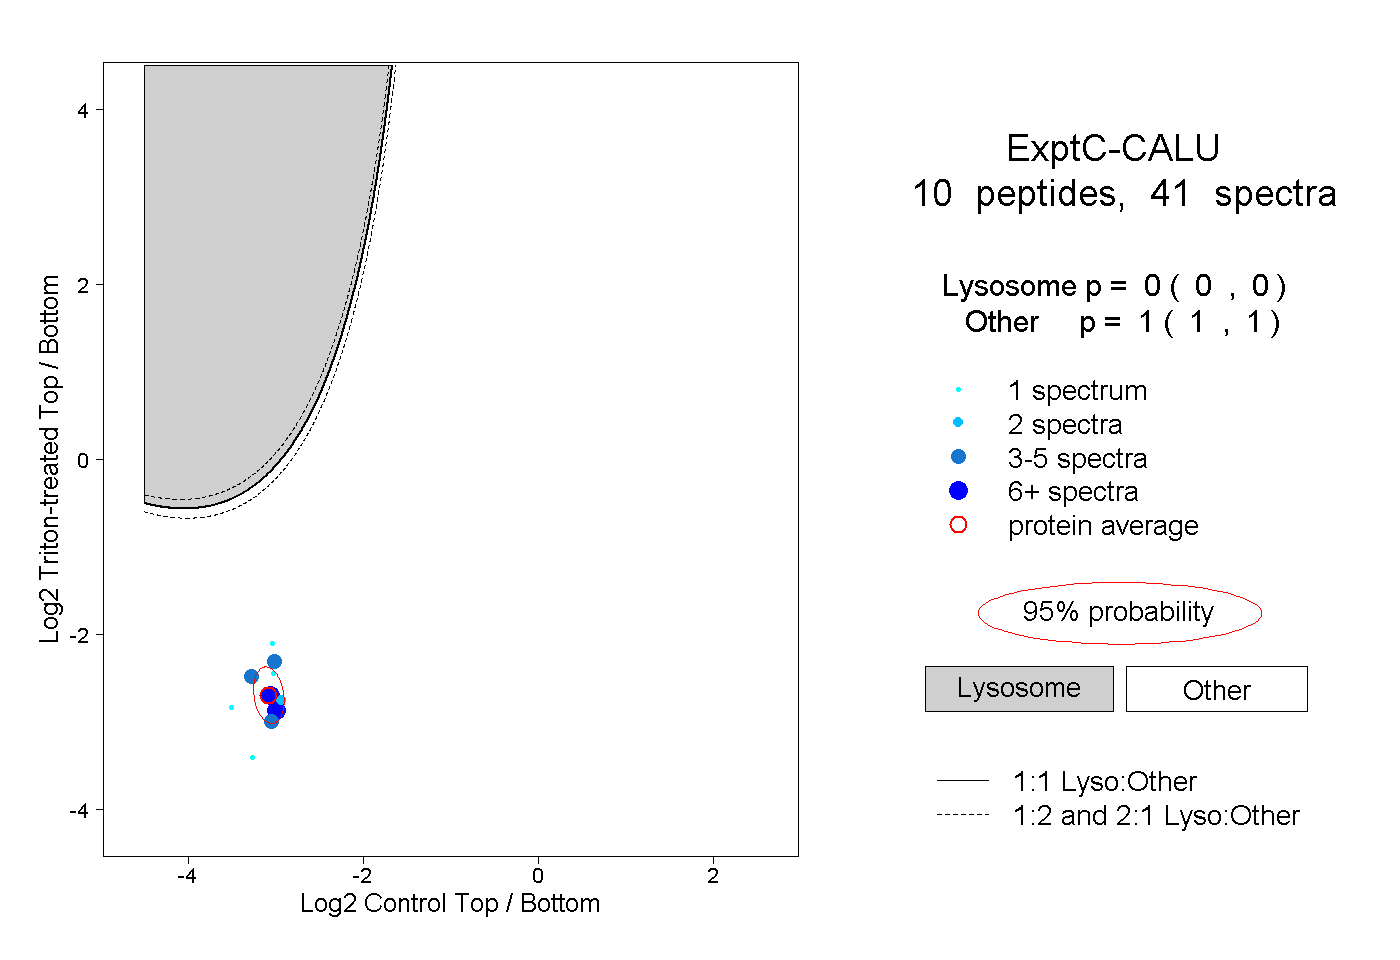
| Expt C |
10
peptides |
41
spectra |
 |
|
0.000
0.000 | 0.000 |
|
|
|
|
|
|
|
1.000
1.000 | 1.000 |
| | | Plot |
|
Lyso |
|
|
|
|
|
|
|
Other |
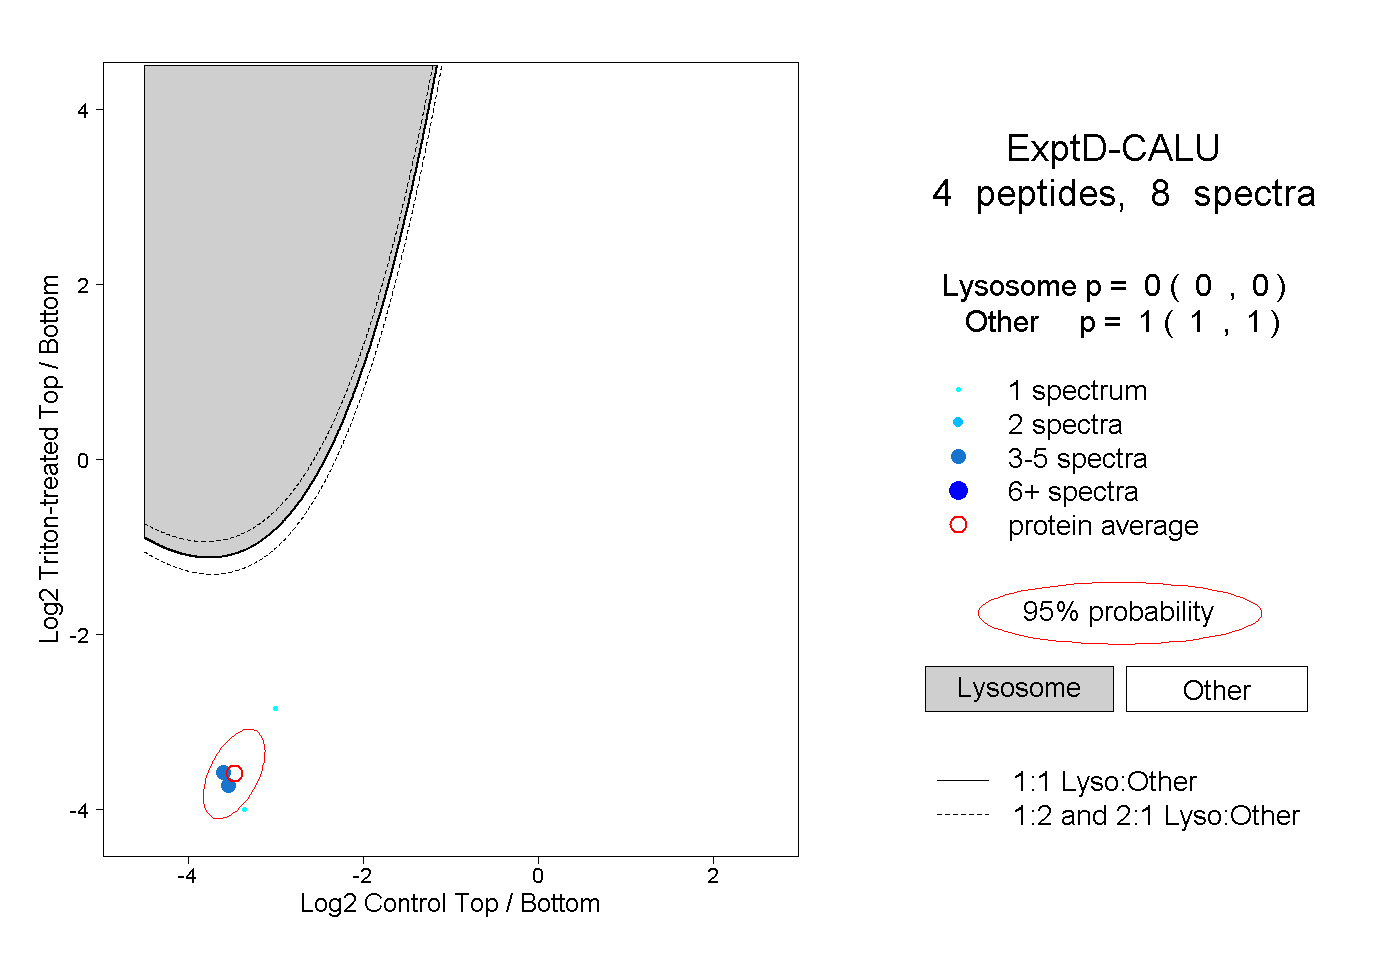
| Expt D |
4
peptides |
8
spectra |
 |
|
0.000
0.000 | 0.000 |
|
|
|
|
|
|
|
1.000
1.000 | 1.000 |