 38
38peptides
spectra
0.000 | 0.000
0.034 | 0.037
0.000 | 0.000
0.000 | 0.000
0.049 | 0.055
0.008 | 0.015
0.898 | 0.901
0.000 | 0.000
| Plot | Mito | Lyso | Perox | ER | Golgi | PM | Cytosol | Nucleus | |||||
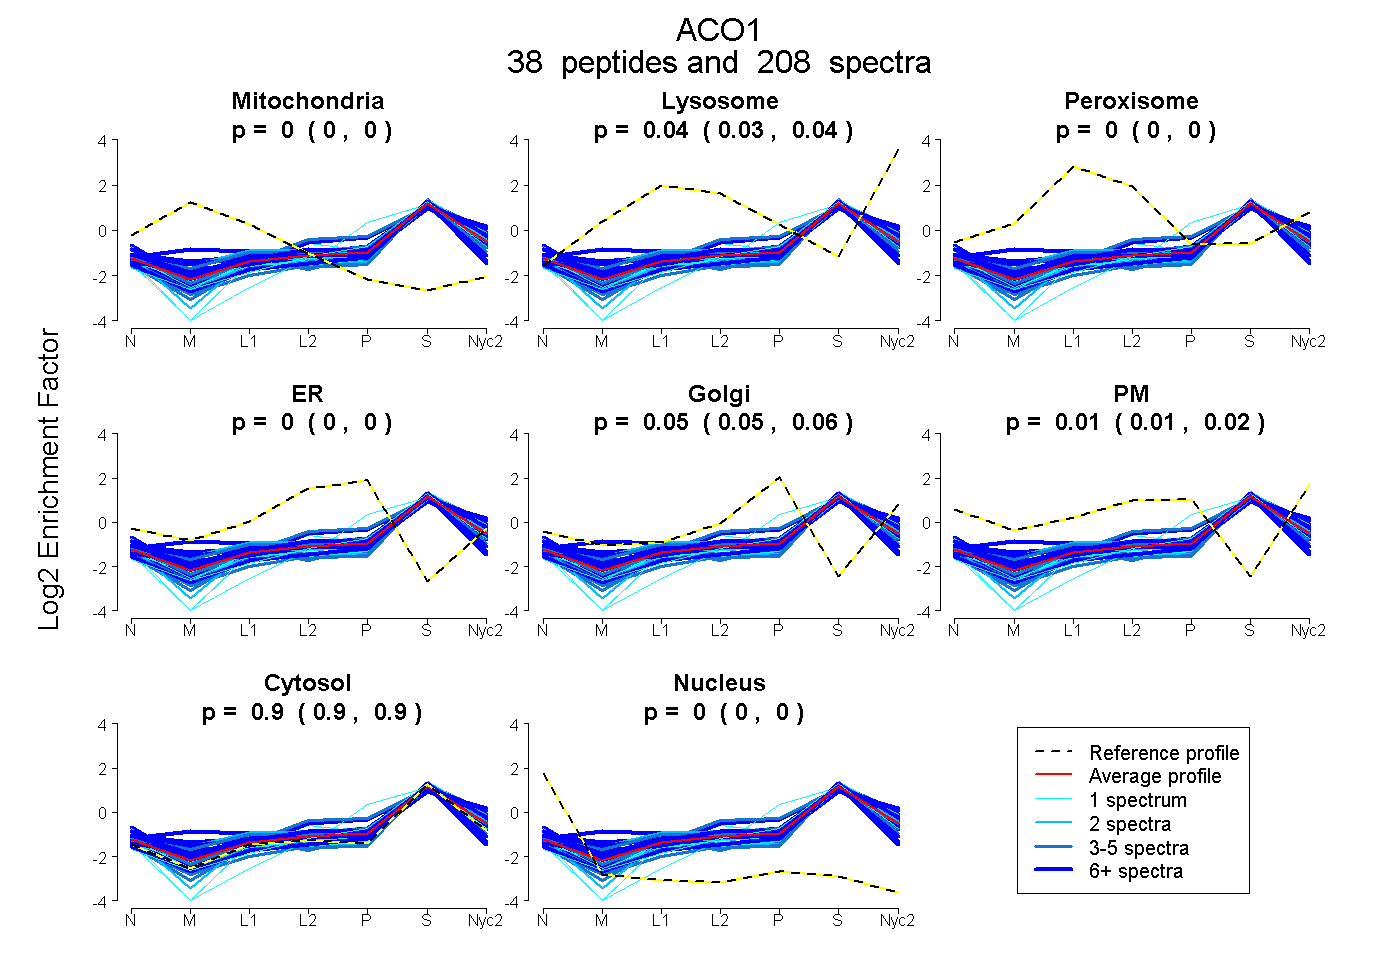
| Expt A |
38 peptides |
208 spectra |
|
0.000 0.000 | 0.000 |
0.036 0.034 | 0.037 |
0.000 0.000 | 0.000 |
0.000 0.000 | 0.000 |
0.052 0.049 | 0.055 |
0.012 0.008 | 0.015 |
0.900 0.898 | 0.901 |
0.000 0.000 | 0.000 |
| 4 spectra, DEIQEVER | 0.000 | 0.000 | 0.000 | 0.000 | 0.000 | 0.000 | 0.995 | 0.005 | ||
| 9 spectra, DFESCLGAK | 0.000 | 0.000 | 0.028 | 0.002 | 0.056 | 0.000 | 0.913 | 0.000 | ||
| 12 spectra, NCDEFLVK | 0.067 | 0.000 | 0.000 | 0.001 | 0.000 | 0.000 | 0.919 | 0.014 | ||
| 1 spectrum, VILQDFTGVPAVVDFAAMR | 0.000 | 0.000 | 0.000 | 0.000 | 0.000 | 0.000 | 1.000 | 0.000 | ||
| 10 spectra, VLLEAAVR | 0.000 | 0.000 | 0.000 | 0.000 | 0.005 | 0.000 | 0.995 | 0.000 | ||
| 1 spectrum, VAVSEMK | 0.000 | 0.002 | 0.000 | 0.000 | 0.000 | 0.000 | 0.998 | 0.000 | ||
| 4 spectra, FFNLNK | 0.000 | 0.075 | 0.000 | 0.000 | 0.021 | 0.037 | 0.867 | 0.000 | ||
| 12 spectra, YLQAVGMFR | 0.000 | 0.149 | 0.000 | 0.000 | 0.051 | 0.000 | 0.800 | 0.000 | ||
| 16 spectra, GNDAIMAR | 0.000 | 0.074 | 0.000 | 0.000 | 0.000 | 0.045 | 0.881 | 0.000 | ||
| 4 spectra, IIPPGSGIIHQVNLEYLAR | 0.000 | 0.000 | 0.000 | 0.000 | 0.025 | 0.000 | 0.975 | 0.000 | ||
| 10 spectra, NQDLEFER | 0.000 | 0.042 | 0.000 | 0.000 | 0.013 | 0.065 | 0.880 | 0.000 | ||
| 10 spectra, GPFLLGIK | 0.000 | 0.027 | 0.000 | 0.000 | 0.036 | 0.000 | 0.937 | 0.000 | ||
| 2 spectra, ADSLQK | 0.000 | 0.035 | 0.000 | 0.000 | 0.000 | 0.129 | 0.836 | 0.000 | ||
| 7 spectra, LYAWNPK | 0.000 | 0.056 | 0.009 | 0.000 | 0.085 | 0.000 | 0.851 | 0.000 | ||
| 2 spectra, NDIENILNWSIMQHK | 0.031 | 0.158 | 0.000 | 0.000 | 0.000 | 0.012 | 0.800 | 0.000 | ||
| 1 spectrum, YVIPGMFK | 0.000 | 0.000 | 0.000 | 0.000 | 0.056 | 0.000 | 0.944 | 0.000 | ||
| 5 spectra, TFQAVMR | 0.009 | 0.150 | 0.000 | 0.000 | 0.020 | 0.000 | 0.821 | 0.000 | ||
| 2 spectra, SWNALAAPSEK | 0.000 | 0.000 | 0.000 | 0.000 | 0.024 | 0.000 | 0.976 | 0.000 | ||
| 2 spectra, TVVPCCSGPK | 0.052 | 0.030 | 0.113 | 0.000 | 0.006 | 0.000 | 0.799 | 0.000 | ||
| 8 spectra, DFNSYGSR | 0.000 | 0.000 | 0.000 | 0.000 | 0.000 | 0.087 | 0.872 | 0.041 | ||
| 12 spectra, WGSQAFCNMR | 0.086 | 0.000 | 0.000 | 0.021 | 0.000 | 0.000 | 0.893 | 0.000 | ||
| 4 spectra, QAPQTVHLPSGETLDVFDAAER | 0.051 | 0.063 | 0.000 | 0.000 | 0.076 | 0.000 | 0.811 | 0.000 | ||
| 1 spectrum, DFSDSSQDPDFTQVVELDLK | 0.000 | 0.000 | 0.018 | 0.052 | 0.000 | 0.071 | 0.859 | 0.000 | ||
| 4 spectra, AVLAESYER | 0.000 | 0.095 | 0.000 | 0.000 | 0.000 | 0.000 | 0.905 | 0.000 | ||
| 9 spectra, YTIHIPEDLKPR | 0.037 | 0.000 | 0.016 | 0.091 | 0.000 | 0.000 | 0.856 | 0.000 | ||
| 3 spectra, YQQAGLPLIVLAGK | 0.002 | 0.014 | 0.096 | 0.000 | 0.088 | 0.000 | 0.800 | 0.000 | ||
| 1 spectrum, QVGVVGK | 0.000 | 0.003 | 0.000 | 0.000 | 0.073 | 0.000 | 0.924 | 0.000 | ||
| 3 spectra, INPVCPADLVIDHSIQVDFNR | 0.000 | 0.000 | 0.000 | 0.000 | 0.000 | 0.000 | 0.982 | 0.018 | ||
| 7 spectra, TSLSPGSGVVTYYLR | 0.060 | 0.115 | 0.000 | 0.000 | 0.000 | 0.031 | 0.793 | 0.000 | ||
| 1 spectrum, LPFSIR | 0.000 | 0.000 | 0.000 | 0.000 | 0.052 | 0.000 | 0.948 | 0.000 | ||
| 1 spectrum, AVEAGLNVKPYVK | 0.000 | 0.000 | 0.000 | 0.000 | 0.000 | 0.000 | 0.990 | 0.010 | ||
| 2 spectra, DIWPTR | 0.000 | 0.000 | 0.000 | 0.000 | 0.000 | 0.000 | 1.000 | 0.000 | ||
| 12 spectra, GTFANIR | 0.093 | 0.193 | 0.000 | 0.000 | 0.000 | 0.000 | 0.714 | 0.000 | ||
| 1 spectrum, NPFAHLAEPLDPAQPGK | 0.000 | 0.000 | 0.000 | 0.000 | 0.159 | 0.000 | 0.841 | 0.000 | ||
| 5 spectra, SIEVPFKPAR | 0.000 | 0.000 | 0.000 | 0.190 | 0.000 | 0.000 | 0.810 | 0.000 | ||
| 6 spectra, EYGSGSSR | 0.000 | 0.000 | 0.000 | 0.073 | 0.076 | 0.076 | 0.775 | 0.000 | ||
| 2 spectra, GFQVAPDHHNDHK | 0.000 | 0.000 | 0.000 | 0.000 | 0.000 | 0.000 | 1.000 | 0.000 | ||
| 12 spectra, LGGNPEK | 0.000 | 0.044 | 0.068 | 0.000 | 0.018 | 0.000 | 0.870 | 0.000 |
| Plot | Mito | Lyso or Perox | ER | Golgi | PM | Cytosol | Nucleus | ||||||
| Expt B |
21 peptides |
56 spectra |
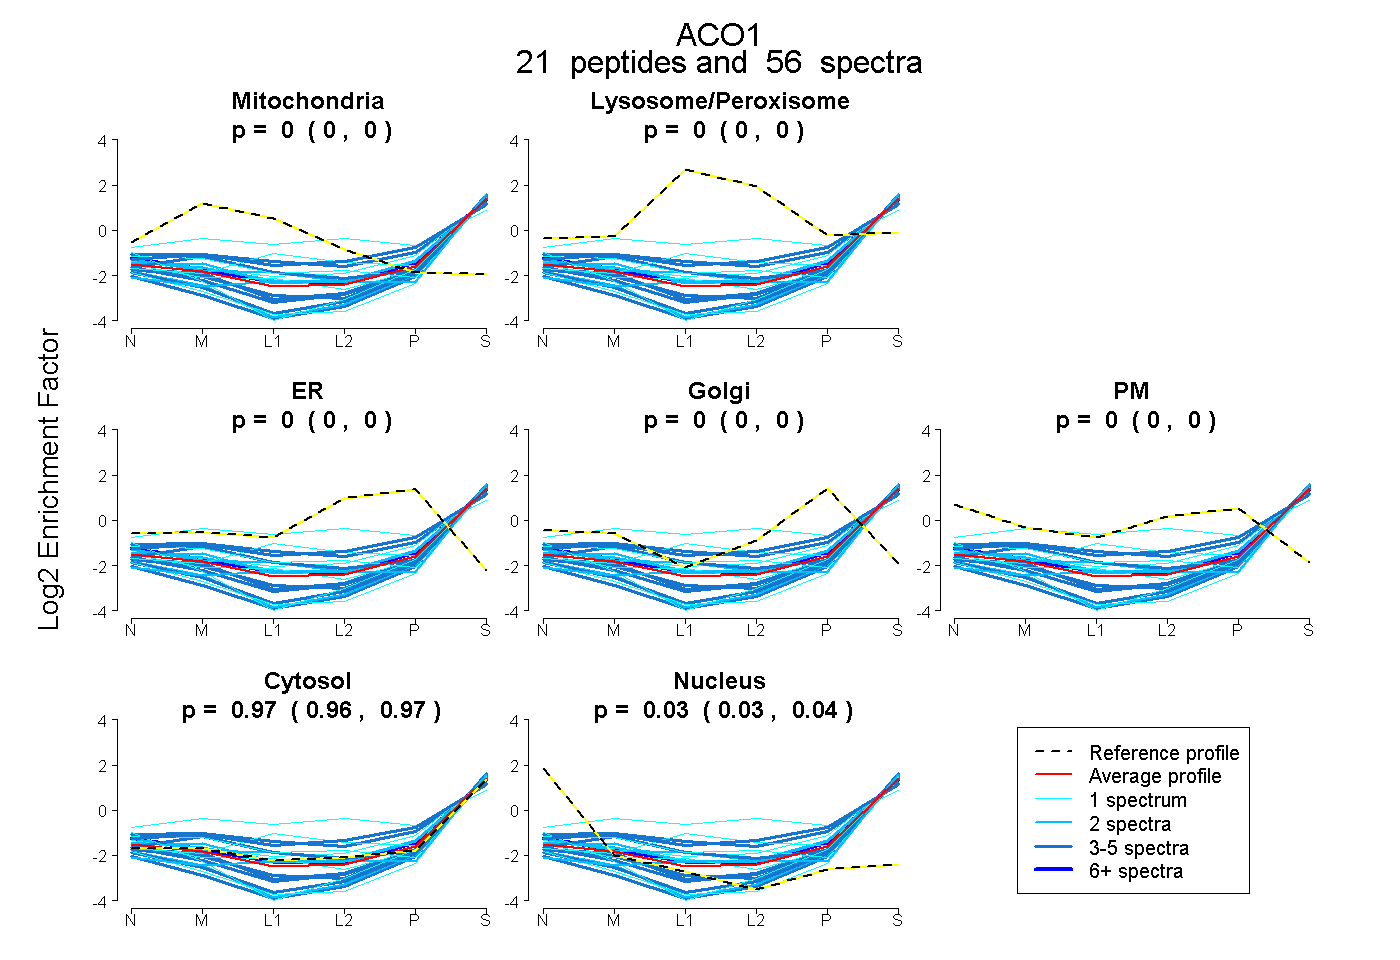 |
0.000 0.000 | 0.000 |
0.000 0.000 | 0.000 |
0.000 0.000 | 0.000 |
0.000 0.000 | 0.000 |
0.000 0.000 | 0.000 |
0.967 0.964 | 0.970 |
0.033 0.029 | 0.036 |
|||
| Plot | Lyso | Other | |||||||||||
| Expt C |
38 peptides |
274 spectra |
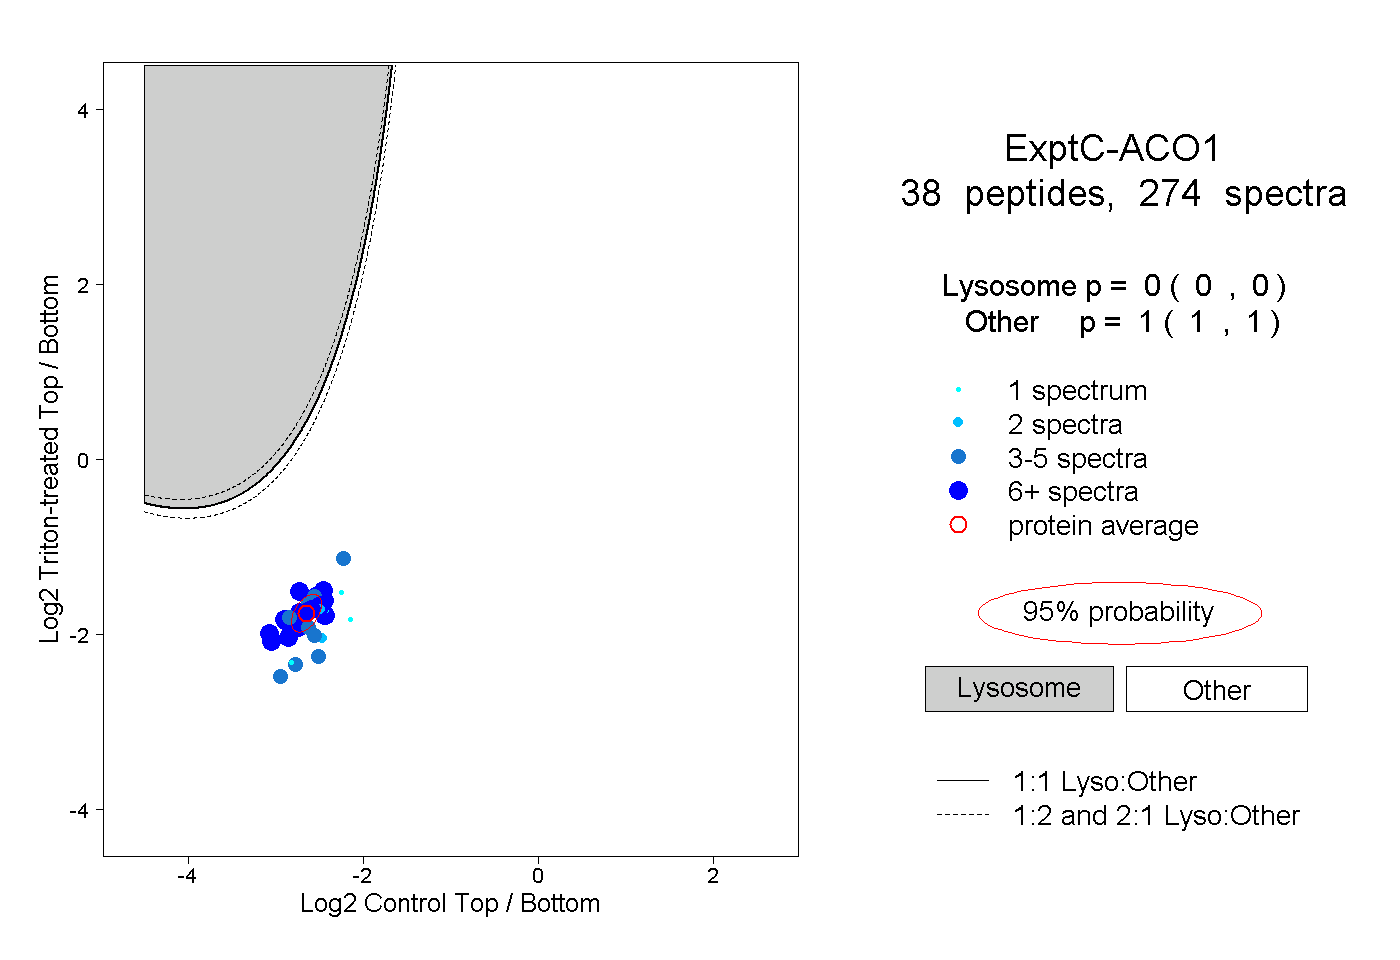 |
0.000 0.000 | 0.000 |
1.000 1.000 | 1.000 |
||||||||
| Plot | Lyso | Other | |||||||||||
| Expt D |
9 peptides |
15 spectra |
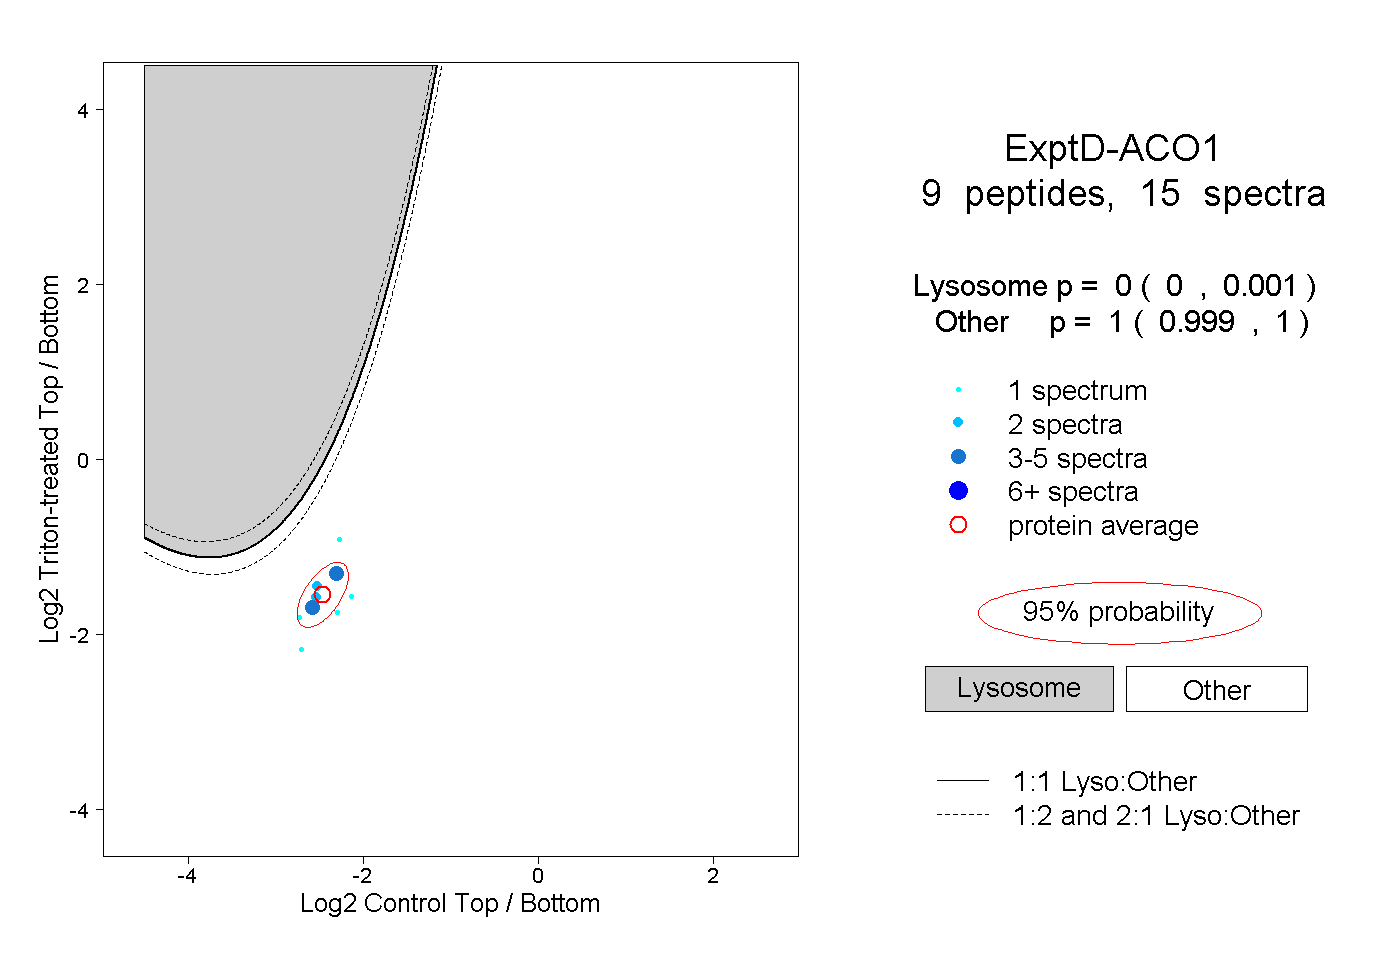 |
0.000 0.000 | 0.001 |
1.000 0.999 | 1.000 |