 11
11peptides
spectra
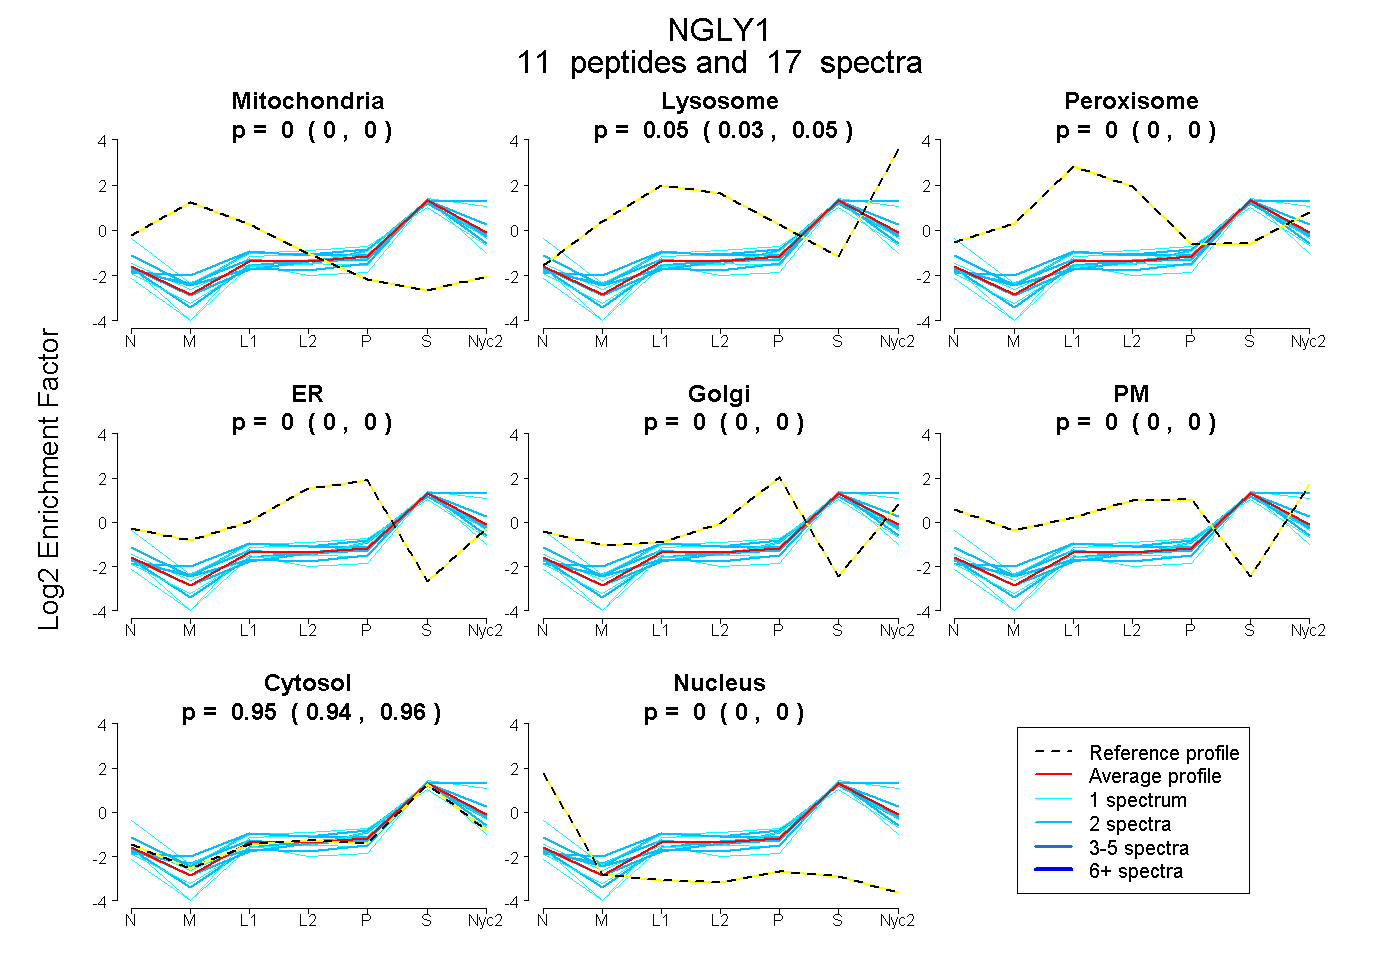
0.000 | 0.000
0.035 | 0.054
0.000 | 0.000
0.000 | 0.000
0.000 | 0.000
0.000 | 0.000
0.945 | 0.963
0.000 | 0.000
4peptides
spectra

0.000 | 0.000
0.000 | 0.061
0.000 | 0.000
0.009 | 0.082
0.000 | 0.000
0.897 | 0.953
0.000 | 0.011
9peptides
spectra
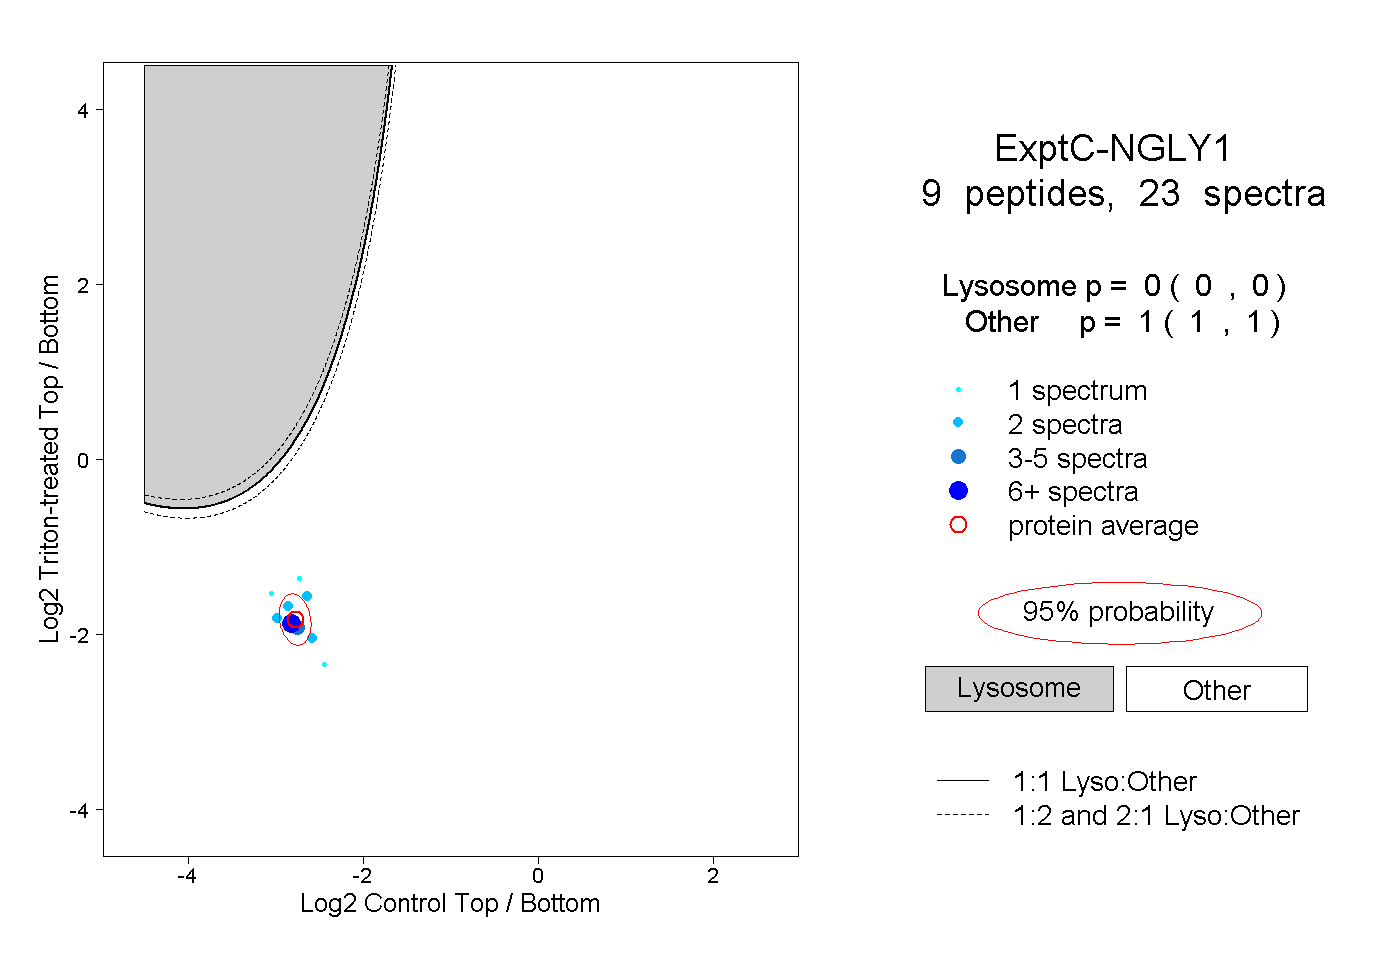
0.000 | 0.000
1.000 | 1.000
1peptide
spectra
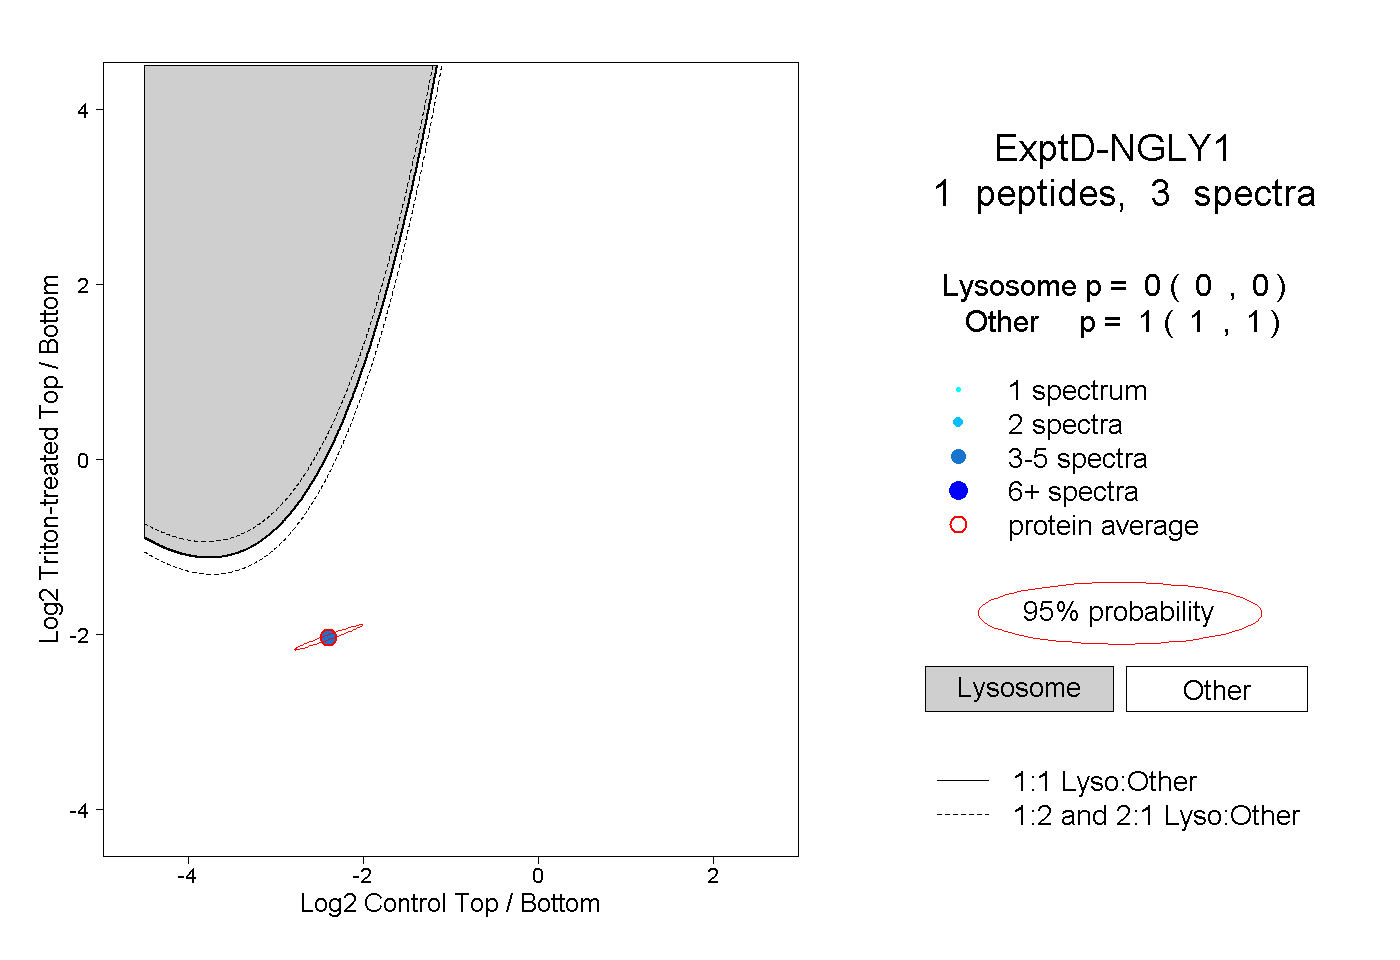
0.000 | 0.000
1.000 | 1.000