 13
13peptides
spectra
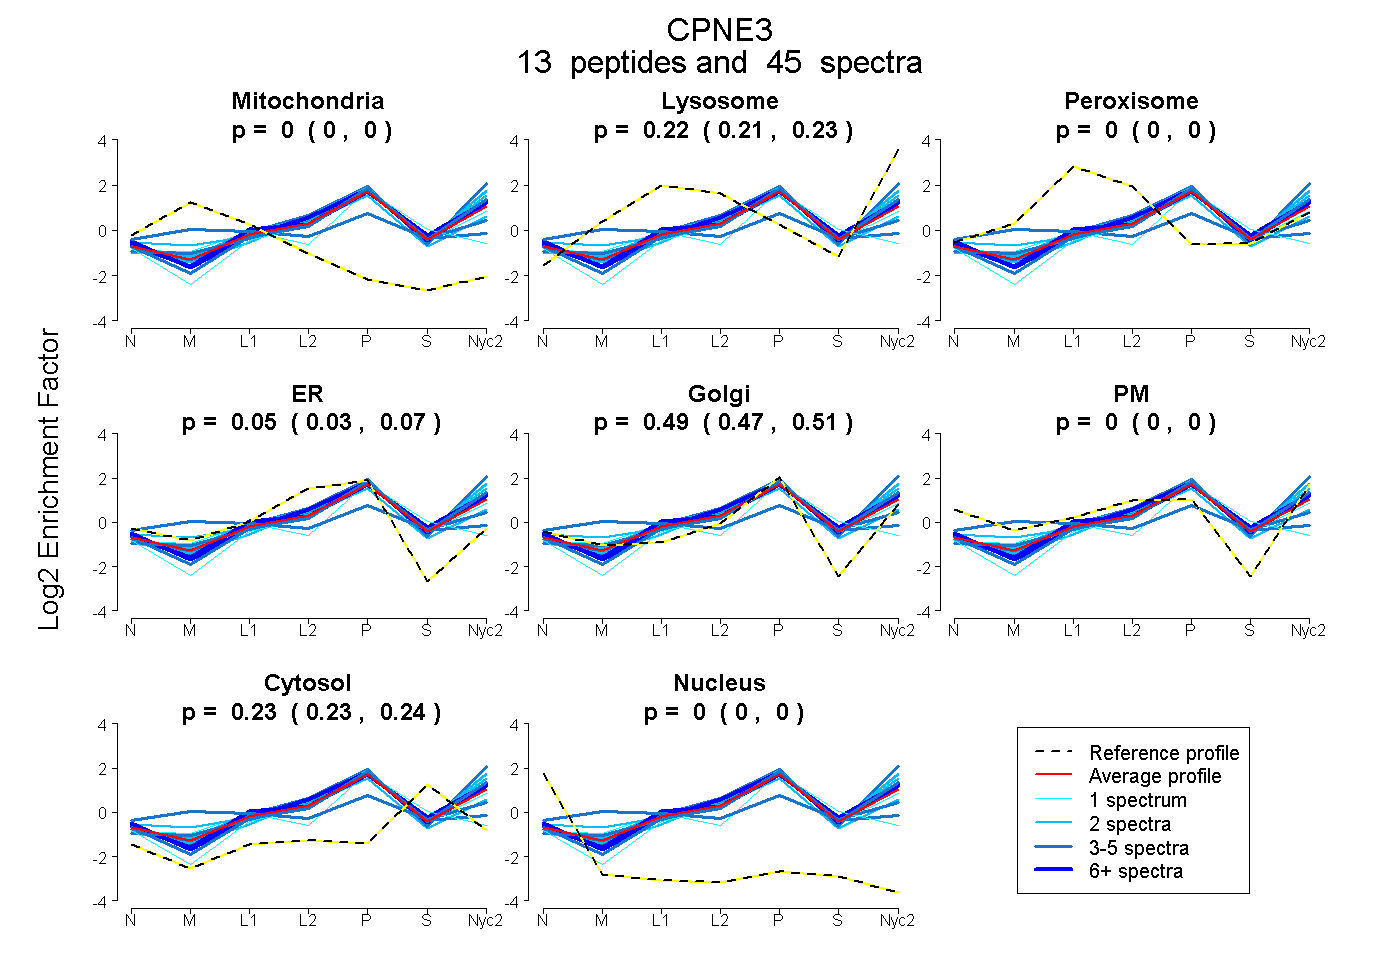
0.000 | 0.000
0.212 | 0.228
0.000 | 0.000
0.031 | 0.070
0.474 | 0.509
0.000 | 0.000
0.228 | 0.238
0.000 | 0.000
14peptides
spectra

0.000 | 0.000
0.189 | 0.205
0.287 | 0.326
0.363 | 0.396
0.000 | 0.000
0.106 | 0.118
0.000 | 0.000
13peptides
spectra
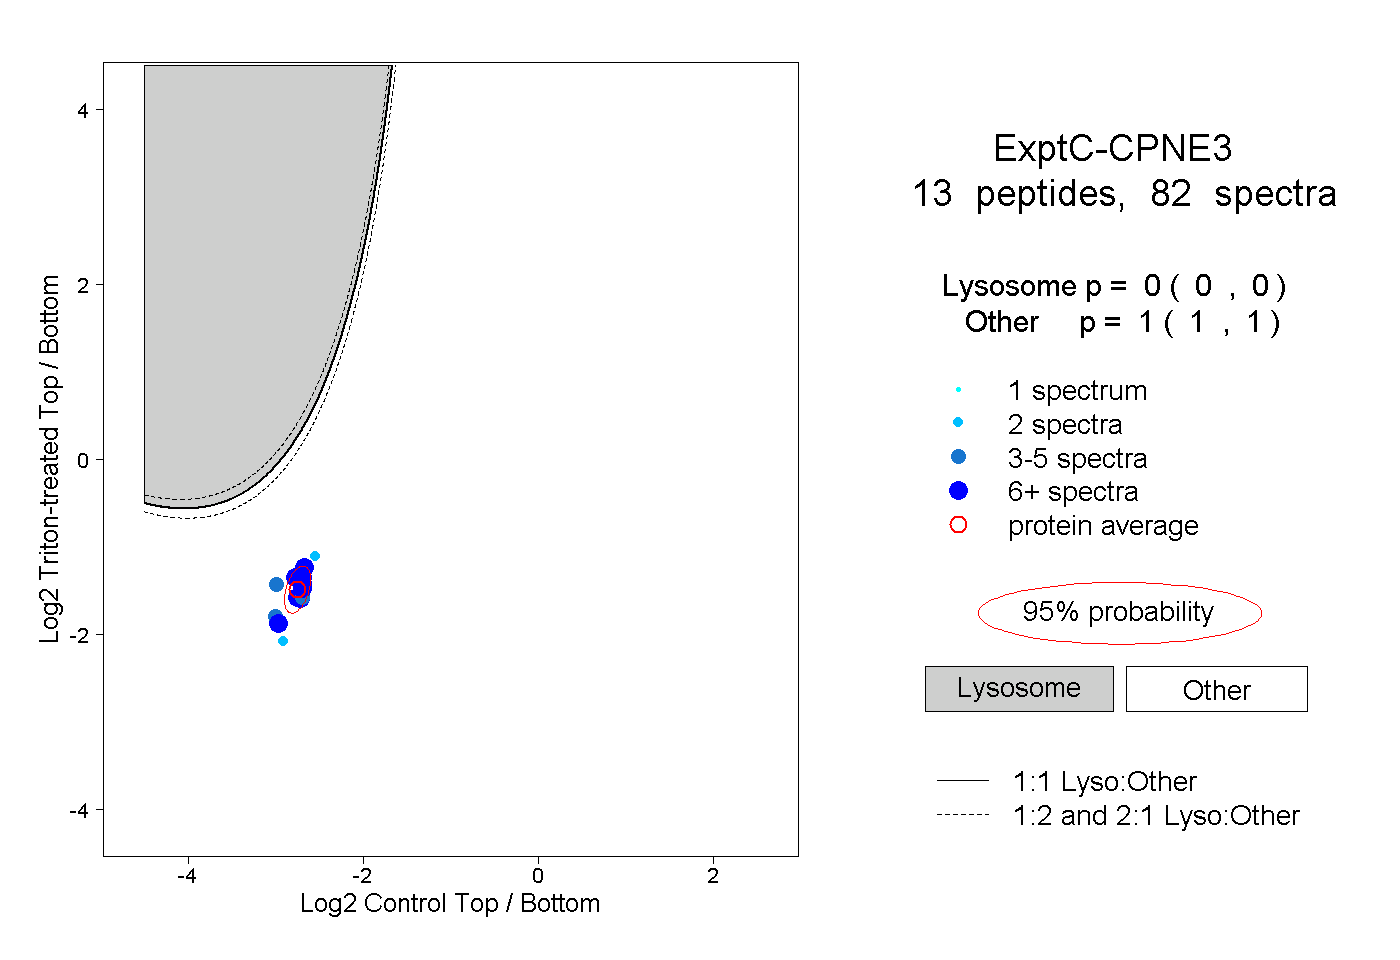
0.000 | 0.000
1.000 | 1.000
6peptides
spectra

0.001 | 0.732
0.258 | 0.999