 4
4peptides
spectra
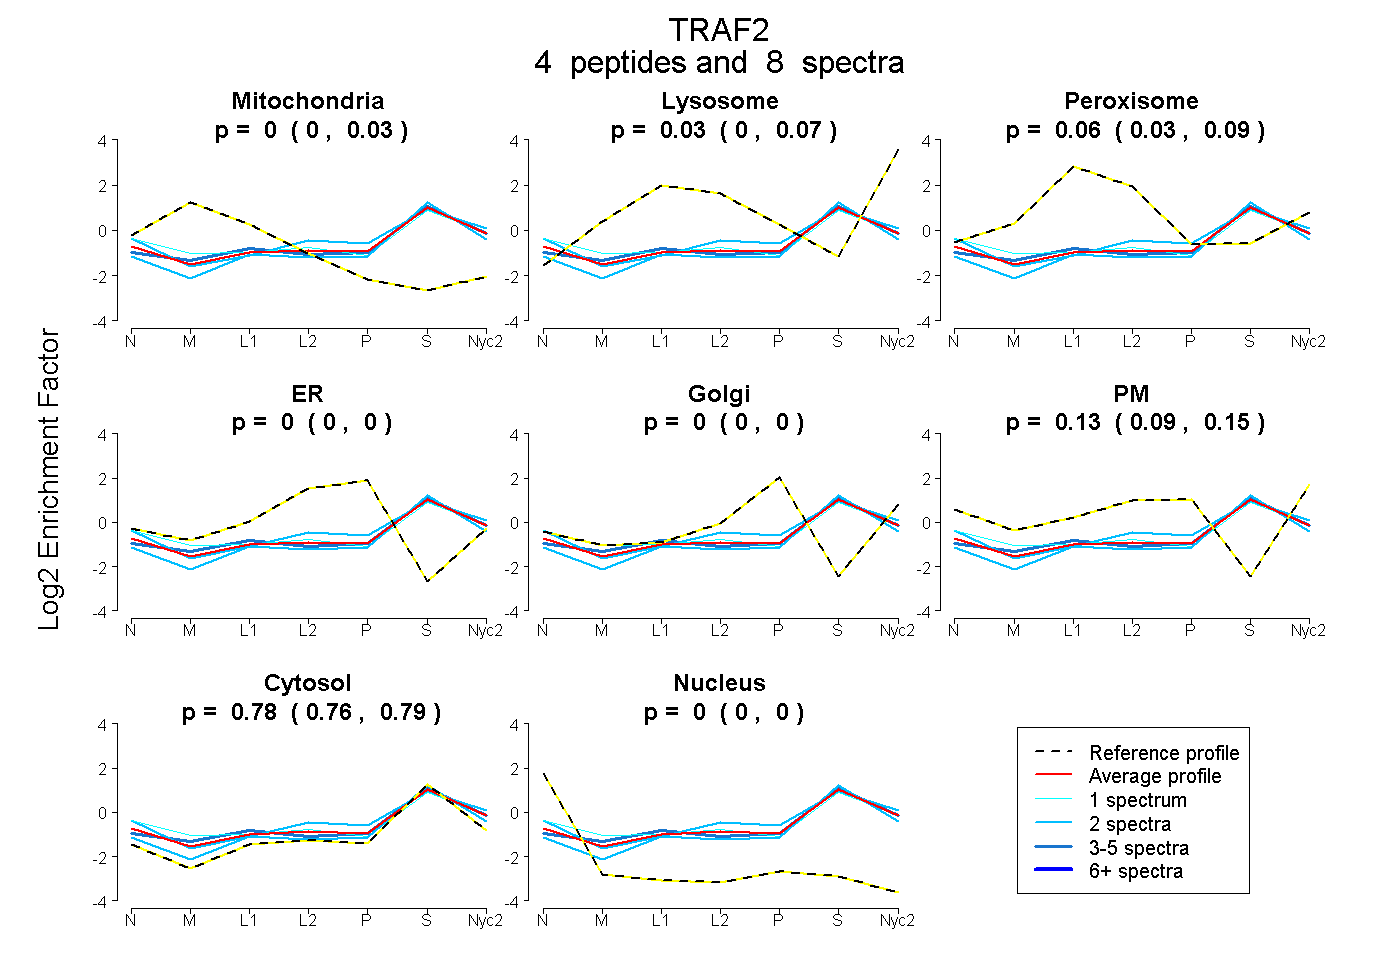
0.000 | 0.029
0.000 | 0.066
0.027 | 0.086
0.000 | 0.000
0.000 | 0.000
0.089 | 0.152
0.758 | 0.791
0.000 | 0.000
| Plot | Mito | Lyso | Perox | ER | Golgi | PM | Cytosol | Nucleus | |||||
| Expt A |
4 peptides |
8 spectra |
|
0.005 0.000 | 0.029 |
0.027 0.000 | 0.066 |
0.064 0.027 | 0.086 |
0.000 0.000 | 0.000 |
0.000 0.000 | 0.000 |
0.127 0.089 | 0.152 |
0.777 0.758 | 0.791 |
0.000 0.000 | 0.000 |