 2
2peptides
spectra
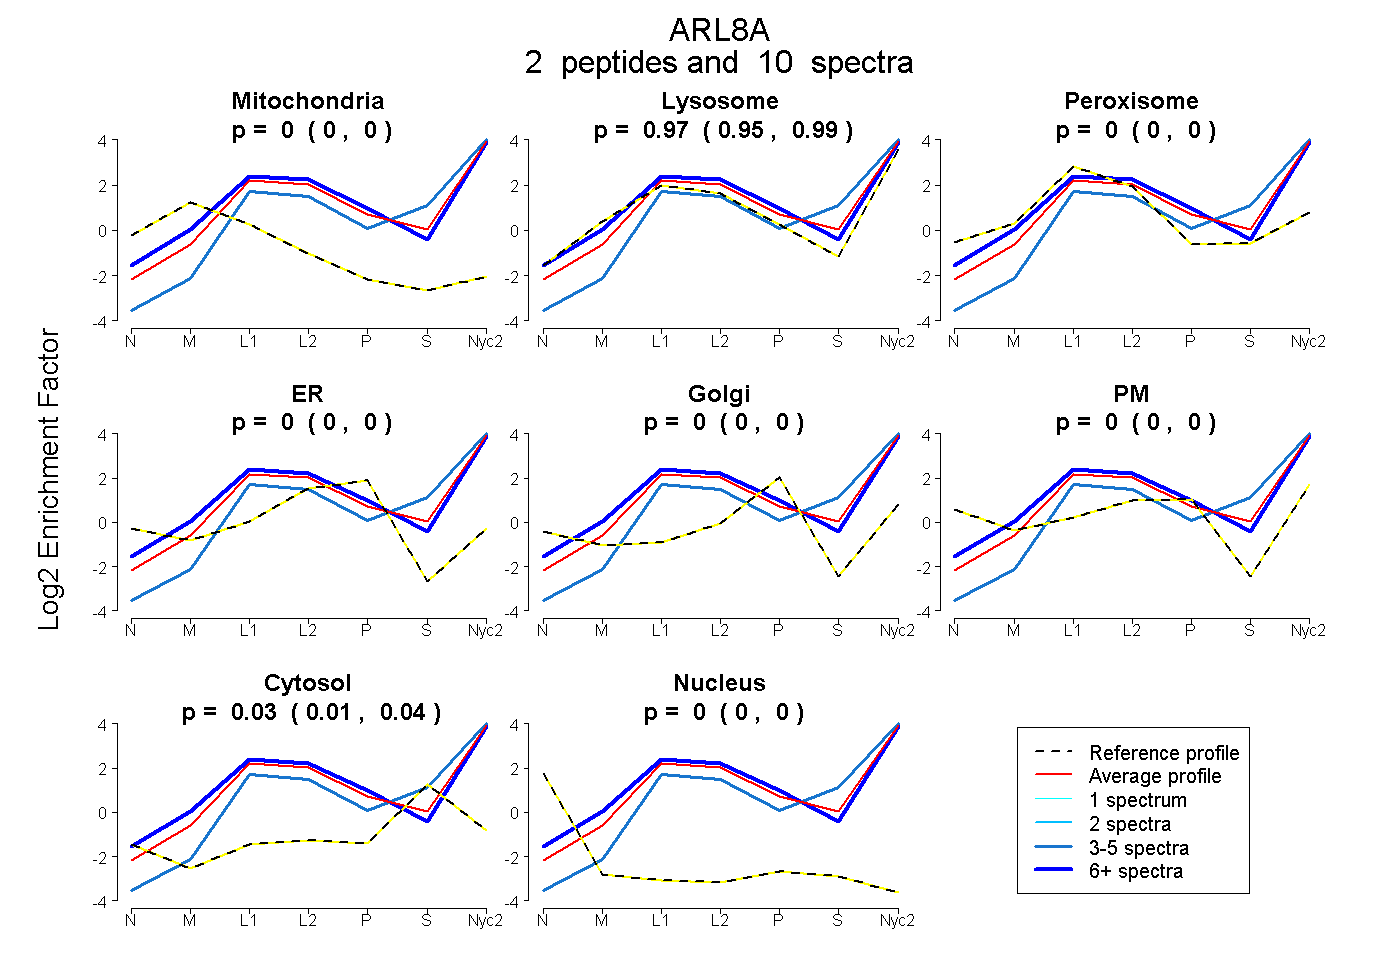
0.000 | 0.000
0.953 | 0.986
0.000 | 0.000
0.000 | 0.000
0.000 | 0.000
0.000 | 0.000
0.012 | 0.043
0.000 | 0.000
2peptides
spectra
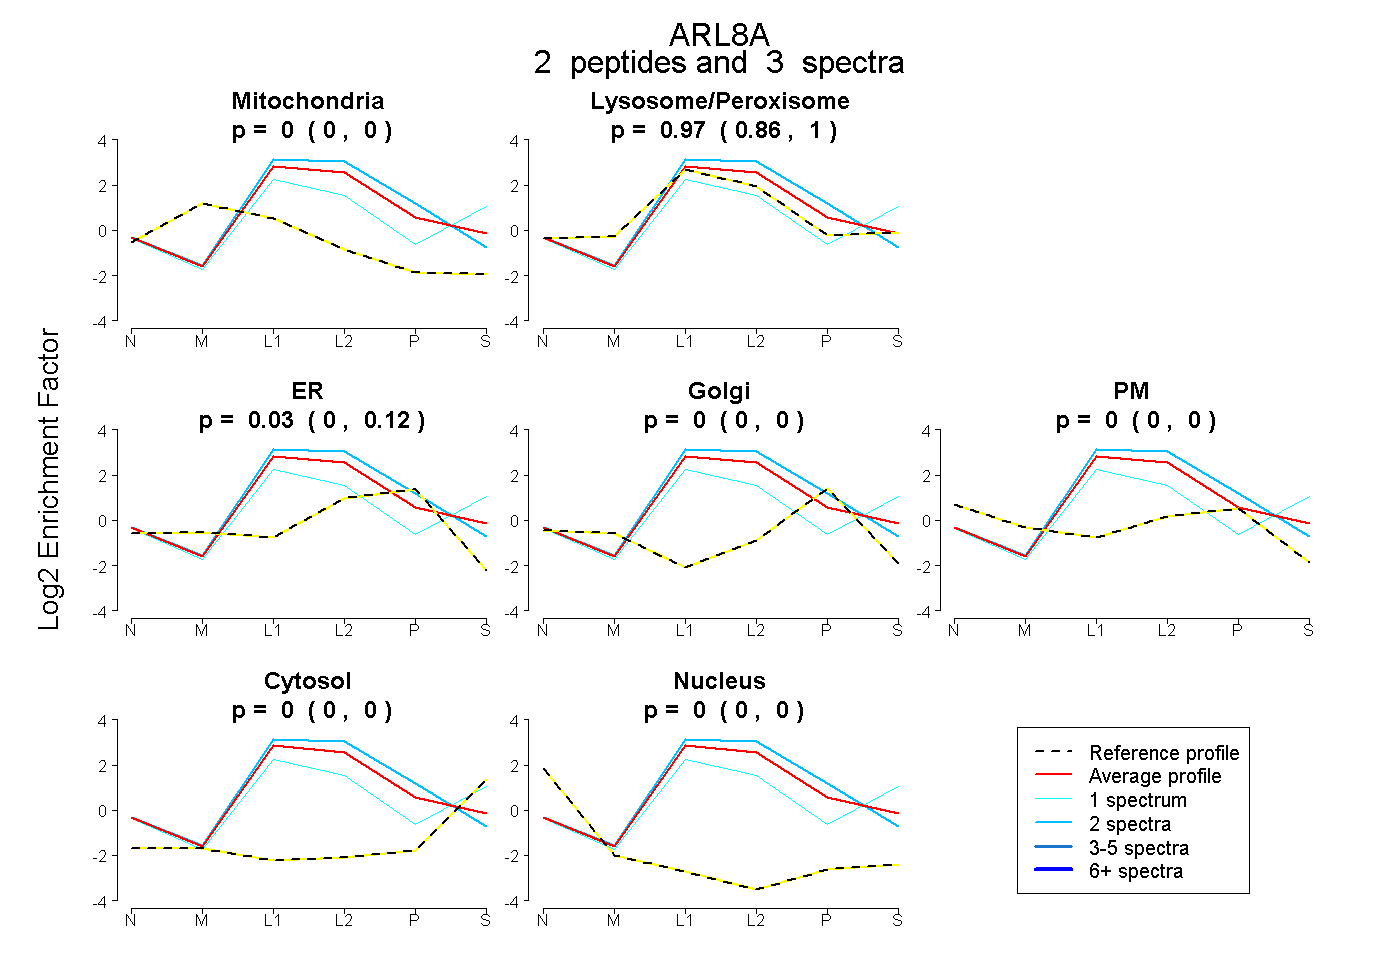
0.000 | 0.000
0.860 | 1.000
0.000 | 0.119
0.000 | 0.000
0.000 | 0.000
0.000 | 0.000
0.000 | 0.000
3peptides
spectra
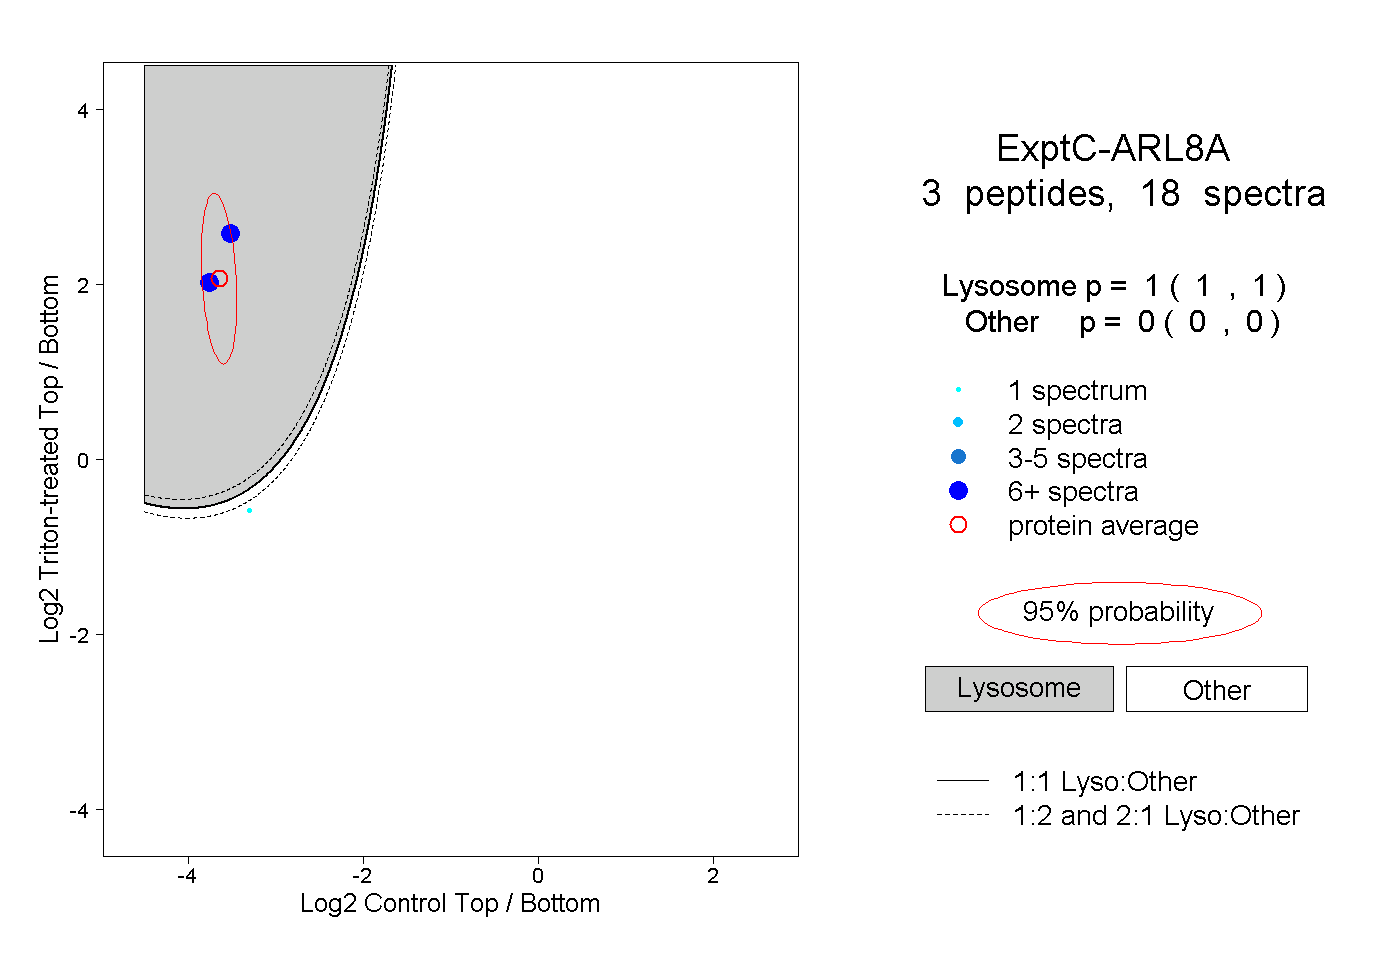
1.000 | 1.000
0.000 | 0.000
1peptide
spectra
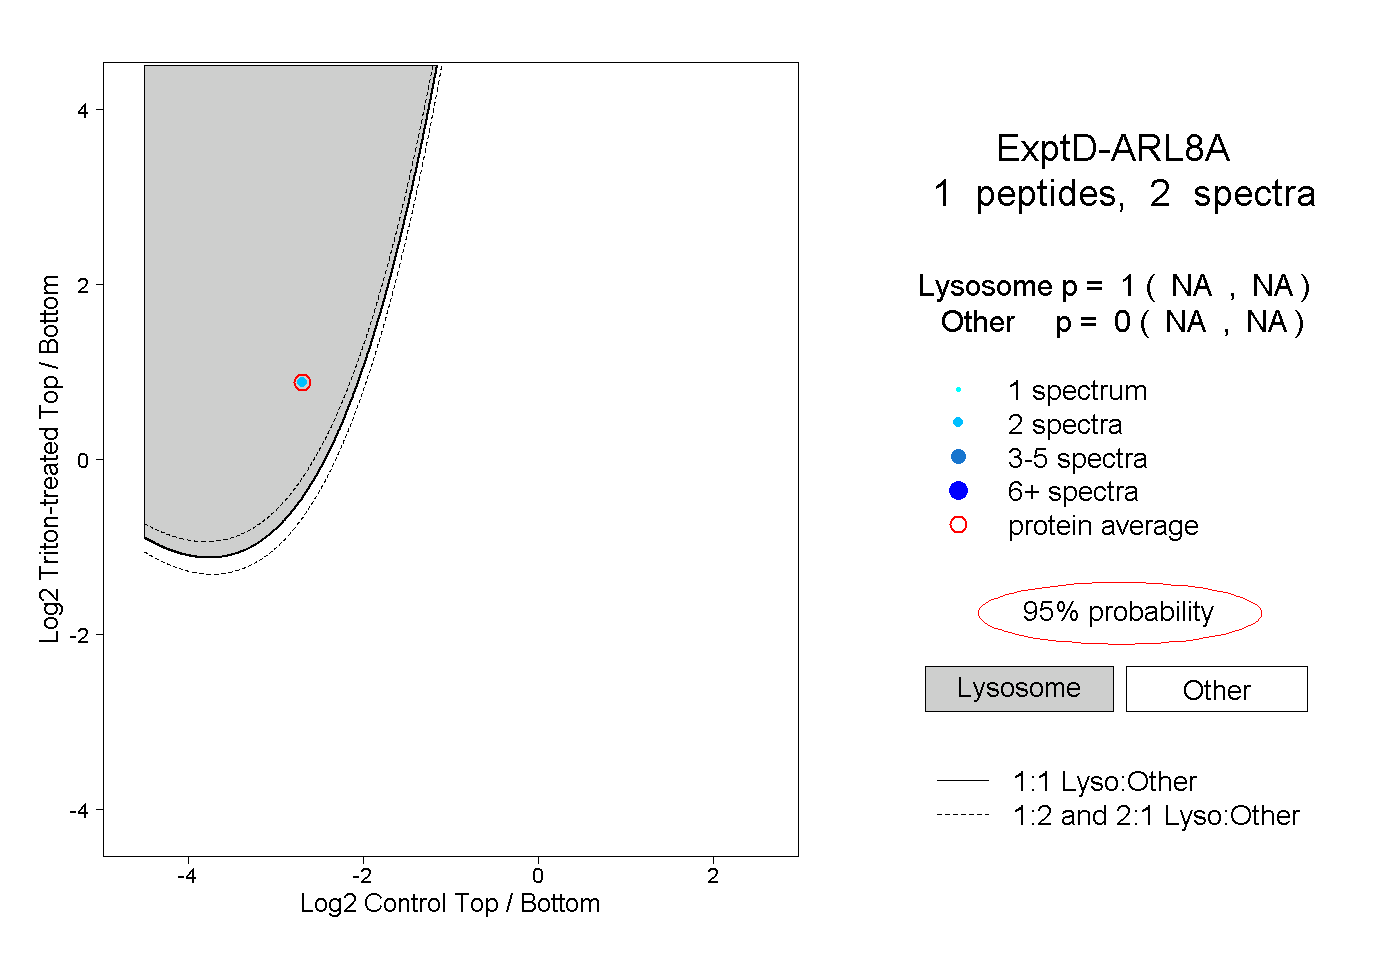
NA | NA
NA | NA