 1
1peptide
spectrum
NA | NA
NA | NA
NA | NA
NA | NA
NA | NA
NA | NA
NA | NA
2peptides
spectra
0.002 | 0.019
0.981 | 0.998
1peptide
spectrum
NA | NA
NA | NA
| Plot | Mito | Lyso or Perox | ER | Golgi | PM | Cytosol | Nucleus | ||||||
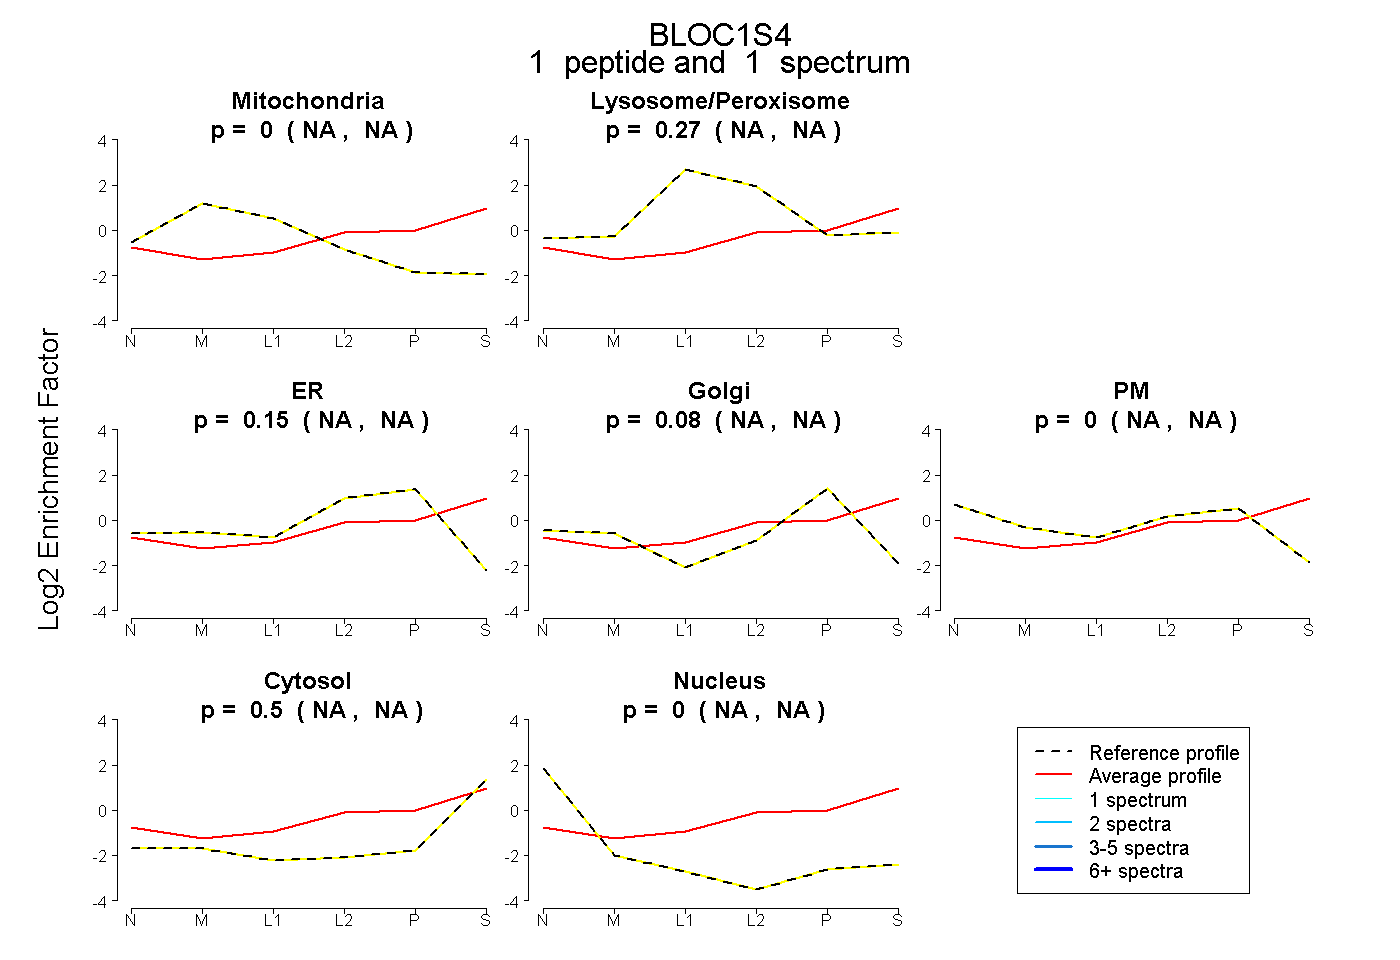
| Expt B |
1 peptide |
1 spectrum |
|
0.000 NA | NA |
0.269 NA | NA |
0.148 NA | NA |
0.079 NA | NA |
0.000 NA | NA |
0.504 NA | NA |
0.000 NA | NA |
|||
| Plot | Lyso | Other | |||||||||||
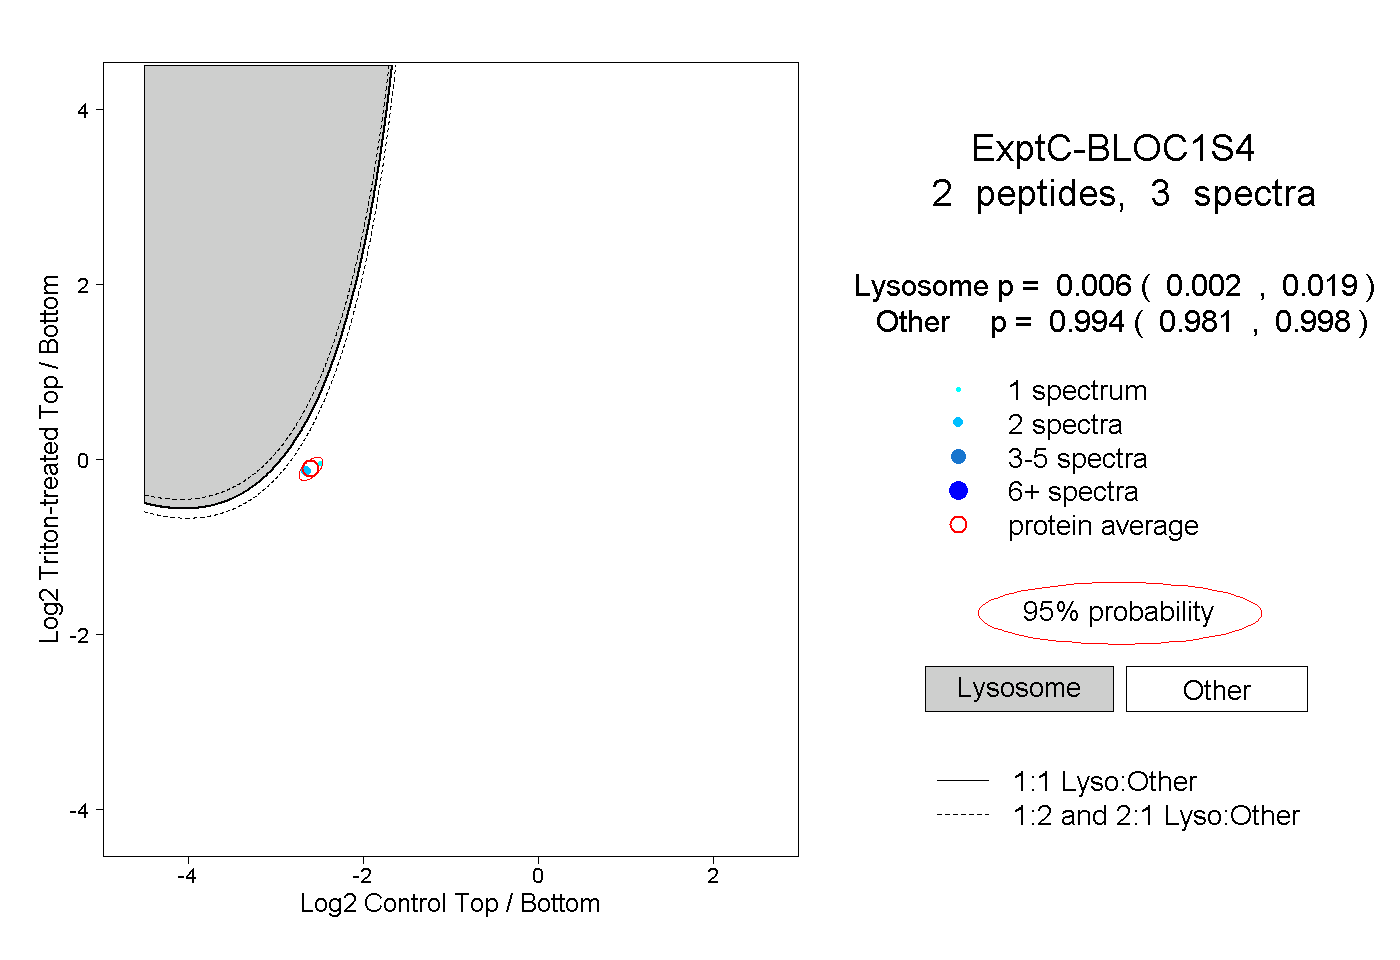
| Expt C |
2 peptides |
3 spectra |
|
0.006 0.002 | 0.019 |
0.994 0.981 | 0.998 |
||||||||
| Plot | Lyso | Other | |||||||||||
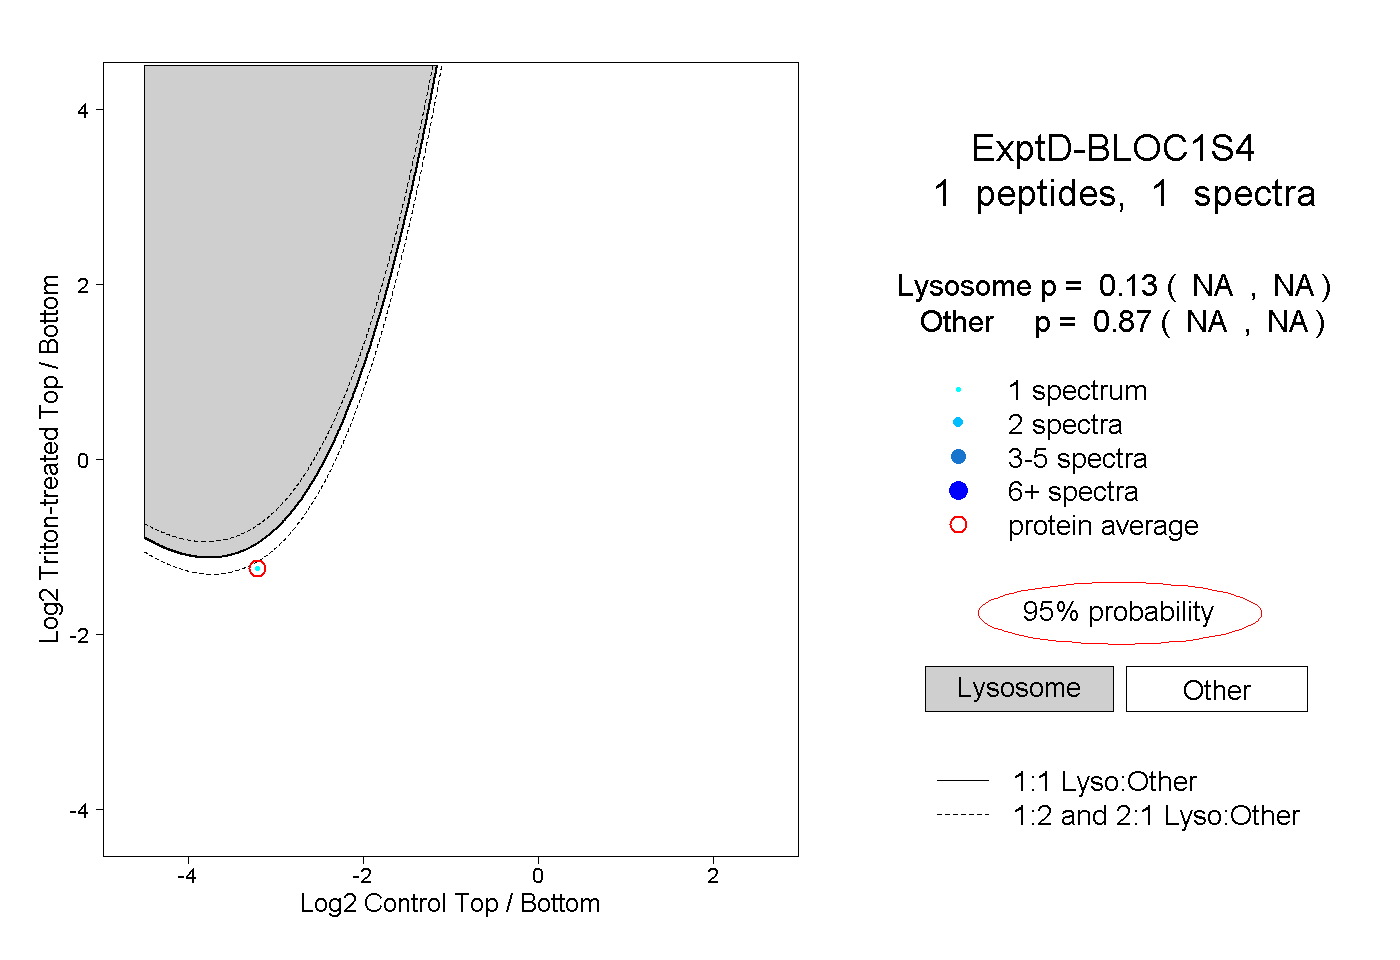
| Expt D |
1 peptide |
1 spectrum |
|
0.130 NA | NA |
0.870 NA | NA |