 3
3peptides
spectra
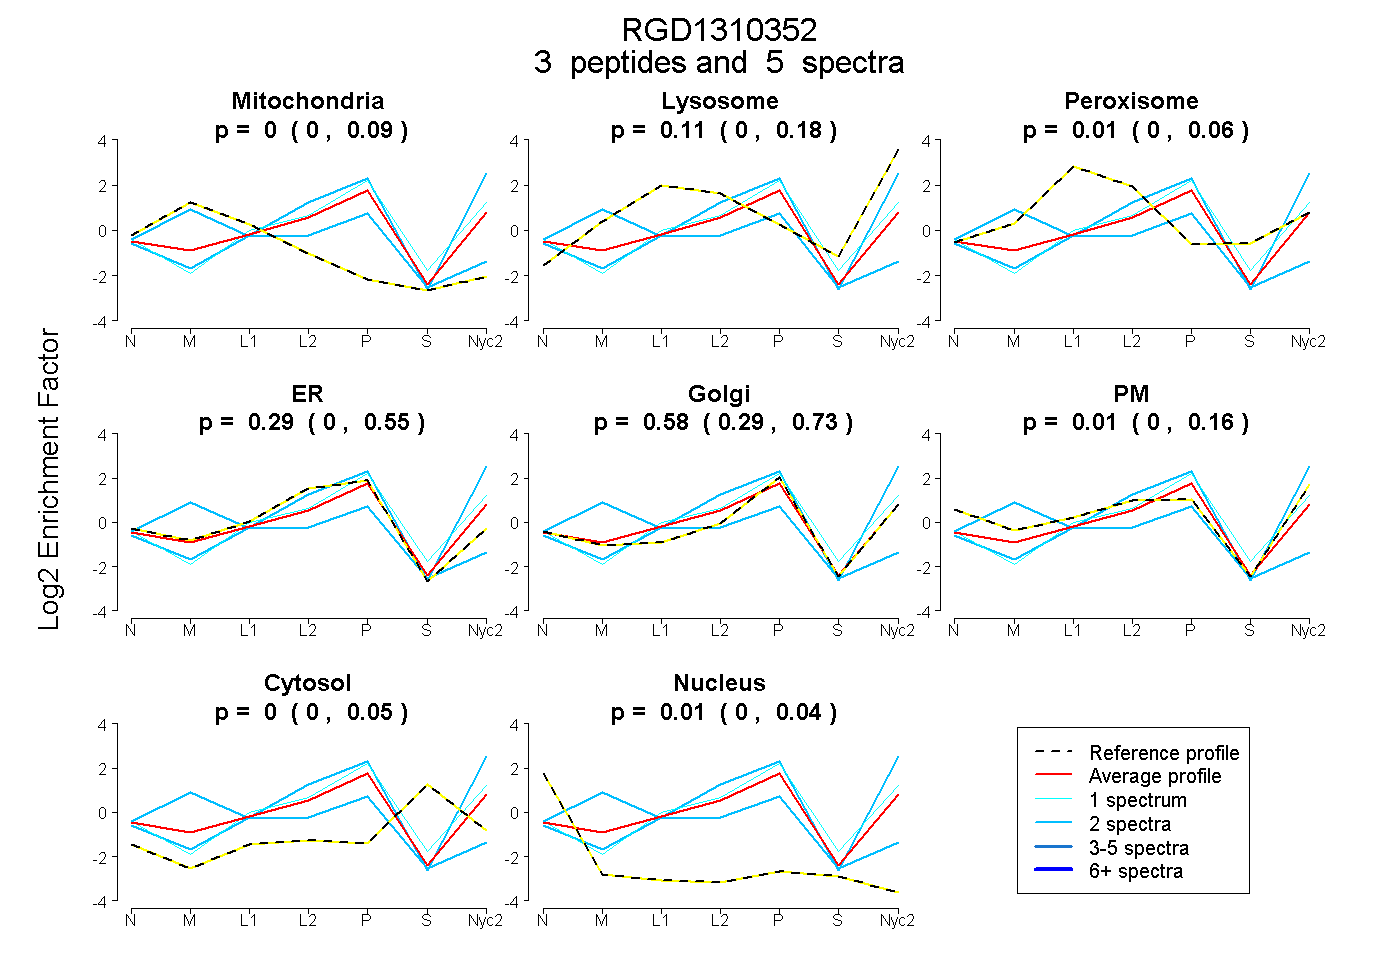
0.000 | 0.091
0.000 | 0.185
0.000 | 0.058
0.000 | 0.550
0.292 | 0.730
0.000 | 0.165
0.000 | 0.051
0.000 | 0.043
| Plot | Mito | Lyso | Perox | ER | Golgi | PM | Cytosol | Nucleus | |||||
| Expt A |
3 peptides |
5 spectra |
|
0.000 0.000 | 0.091 |
0.107 0.000 | 0.185 |
0.009 0.000 | 0.058 |
0.285 0.000 | 0.550 |
0.578 0.292 | 0.730 |
0.014 0.000 | 0.165 |
0.000 0.000 | 0.051 |
0.007 0.000 | 0.043 |
| 2 spectra, MSGAAR | 0.477 | 0.000 | 0.000 | 0.312 | 0.211 | 0.000 | 0.000 | 0.000 | ||
| 1 spectrum, LDQNVNEAMPSLK | 0.000 | 0.133 | 0.000 | 0.176 | 0.658 | 0.000 | 0.033 | 0.000 | ||
| 2 spectra, IFLLVQSR | 0.000 | 0.231 | 0.000 | 0.000 | 0.648 | 0.121 | 0.000 | 0.000 |
| Plot | Lyso | Other | |||||||||||
| Expt C |
3 peptides |
14 spectra |
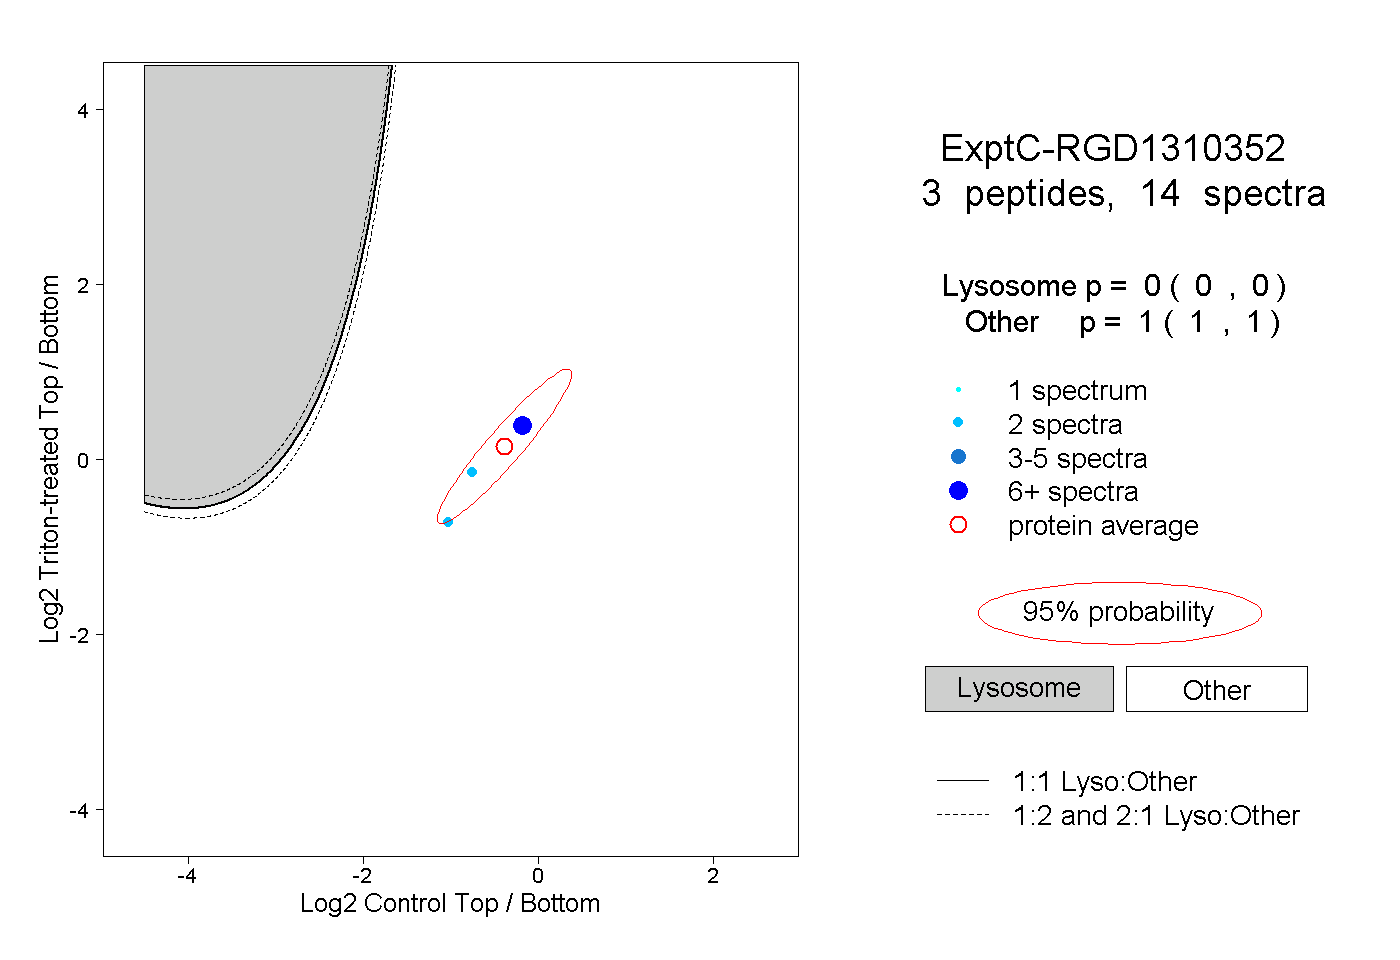 |
0.000 0.000 | 0.000 |
1.000 1.000 | 1.000 |