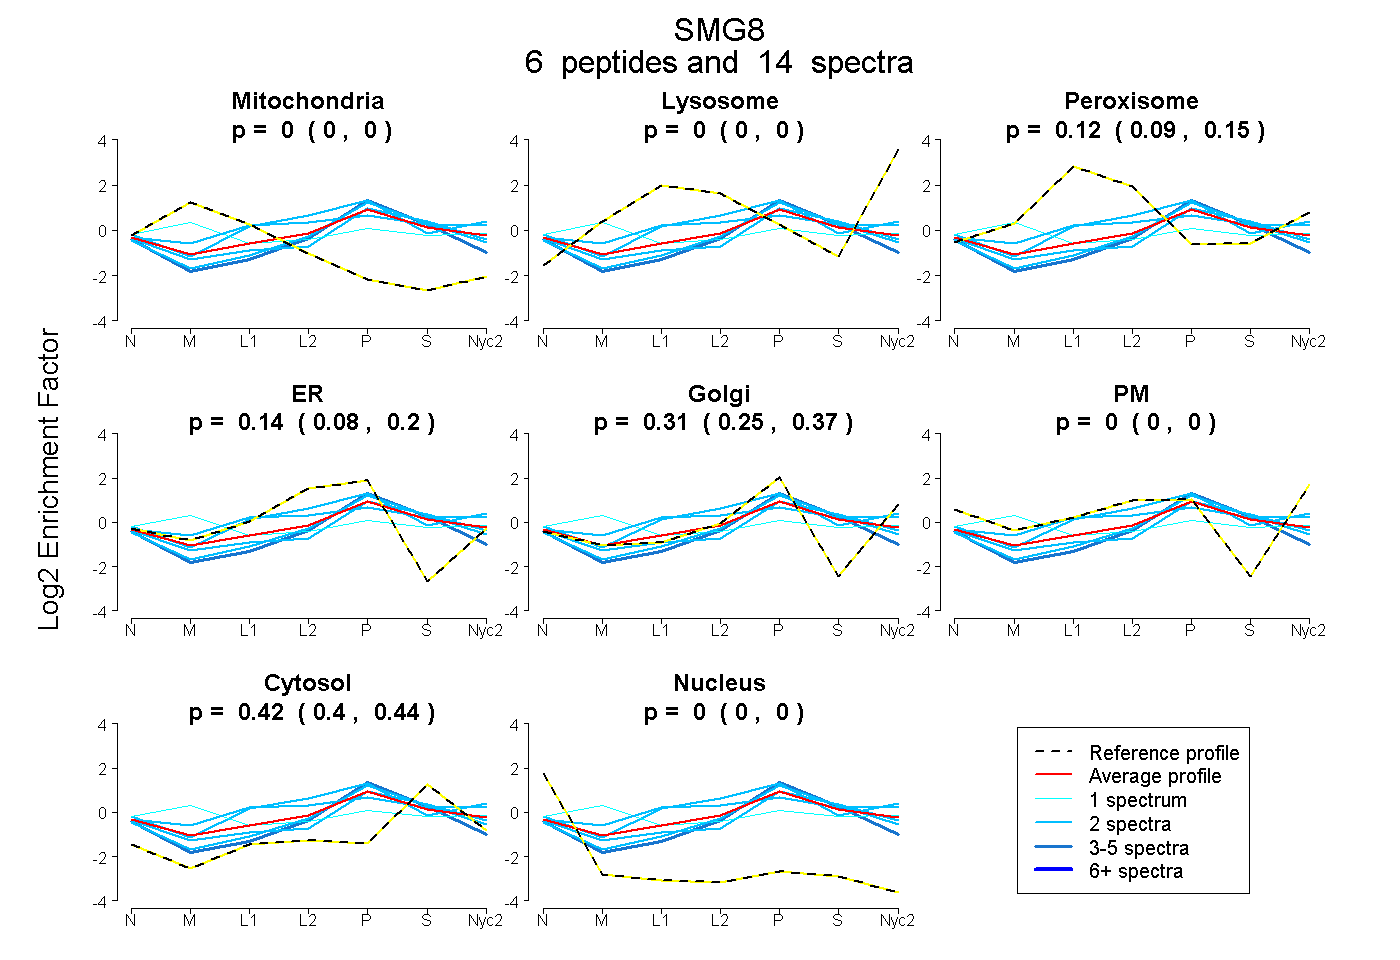
 6
6peptides
spectra
0.000 | 0.000
0.000 | 0.000
0.090 | 0.149
0.075 | 0.201
0.248 | 0.367
0.000 | 0.000
0.398 | 0.440
0.000 | 0.000
| Plot | Mito | Lyso | Perox | ER | Golgi | PM | Cytosol | Nucleus | |||||
| Expt A |
6 peptides |
14 spectra |
|
0.000 0.000 | 0.000 |
0.000 0.000 | 0.000 |
0.122 0.090 | 0.149 |
0.143 0.075 | 0.201 |
0.315 0.248 | 0.367 |
0.000 0.000 | 0.000 |
0.420 0.398 | 0.440 |
0.000 0.000 | 0.000 |
| 2 spectra, FSLVNTVCDR | 0.000 | 0.000 | 0.045 | 0.036 | 0.413 | 0.000 | 0.506 | 0.000 | ||
| 2 spectra, VMGSGPK | 0.000 | 0.000 | 0.375 | 0.000 | 0.322 | 0.000 | 0.303 | 0.000 | ||
| 5 spectra, DDPFDIK | 0.000 | 0.000 | 0.000 | 0.244 | 0.229 | 0.000 | 0.527 | 0.000 | ||
| 2 spectra, VLEGFLDIDTK | 0.000 | 0.000 | 0.000 | 0.217 | 0.274 | 0.000 | 0.509 | 0.000 | ||
| 1 spectrum, LQHALEDQIYR | 0.217 | 0.021 | 0.092 | 0.000 | 0.175 | 0.175 | 0.320 | 0.000 | ||
| 2 spectra, LNCRPCPPR | 0.000 | 0.000 | 0.271 | 0.128 | 0.367 | 0.000 | 0.234 | 0.000 |
| Plot | Lyso | Other | |||||||||||
| Expt C |
3 peptides |
7 spectra |
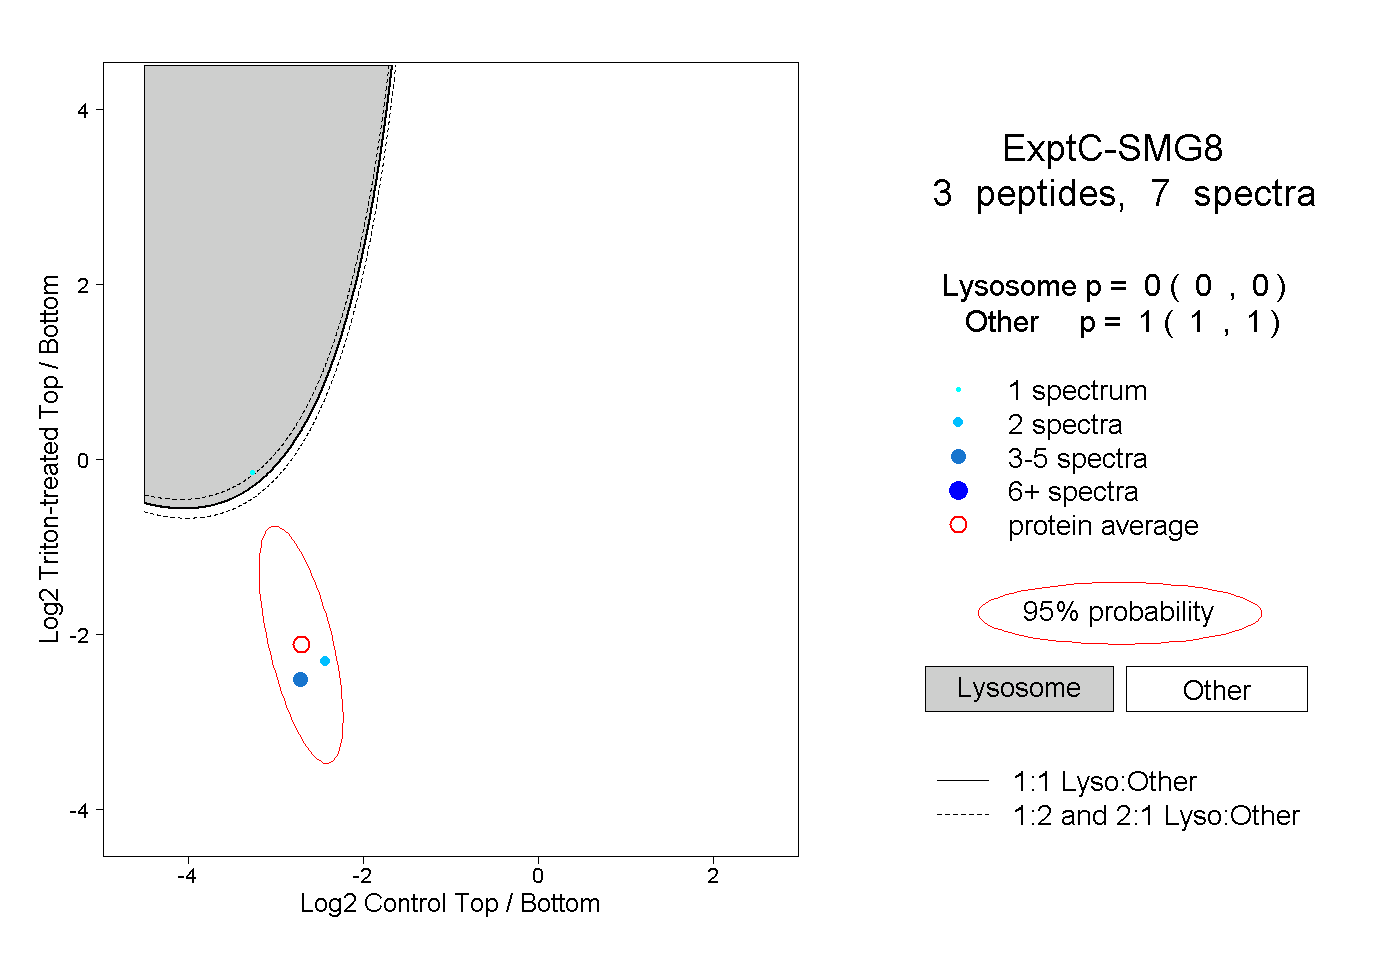 |
0.000 0.000 | 0.000 |
1.000 1.000 | 1.000 |