 1
1peptide
spectra
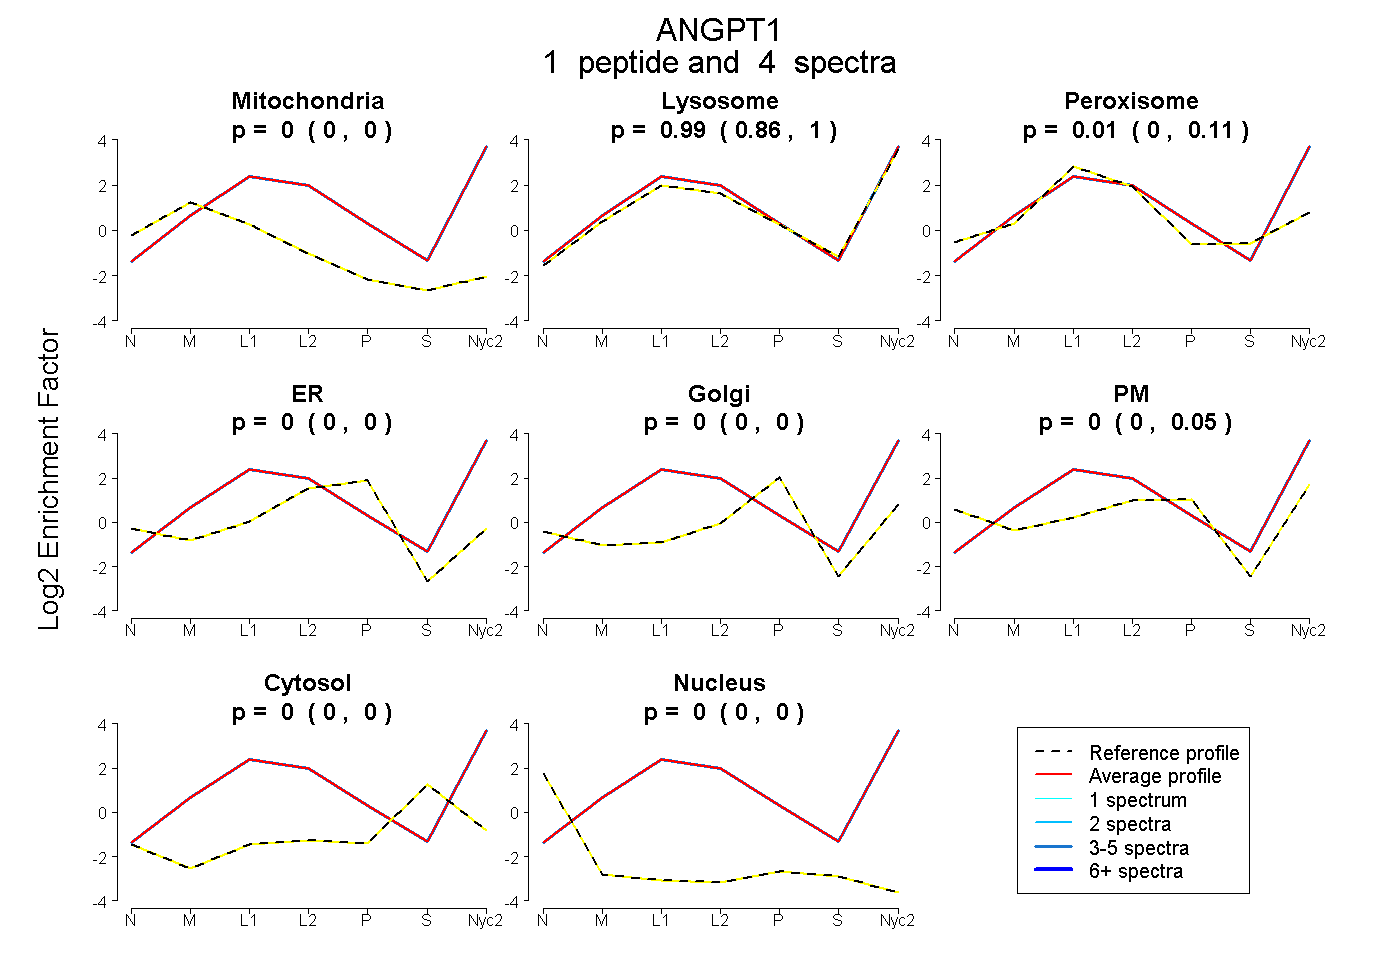
0.000 | 0.000
0.861 | 1.000
0.000 | 0.105
0.000 | 0.000
0.000 | 0.000
0.000 | 0.052
0.000 | 0.000
0.000 | 0.000
1peptide
spectra
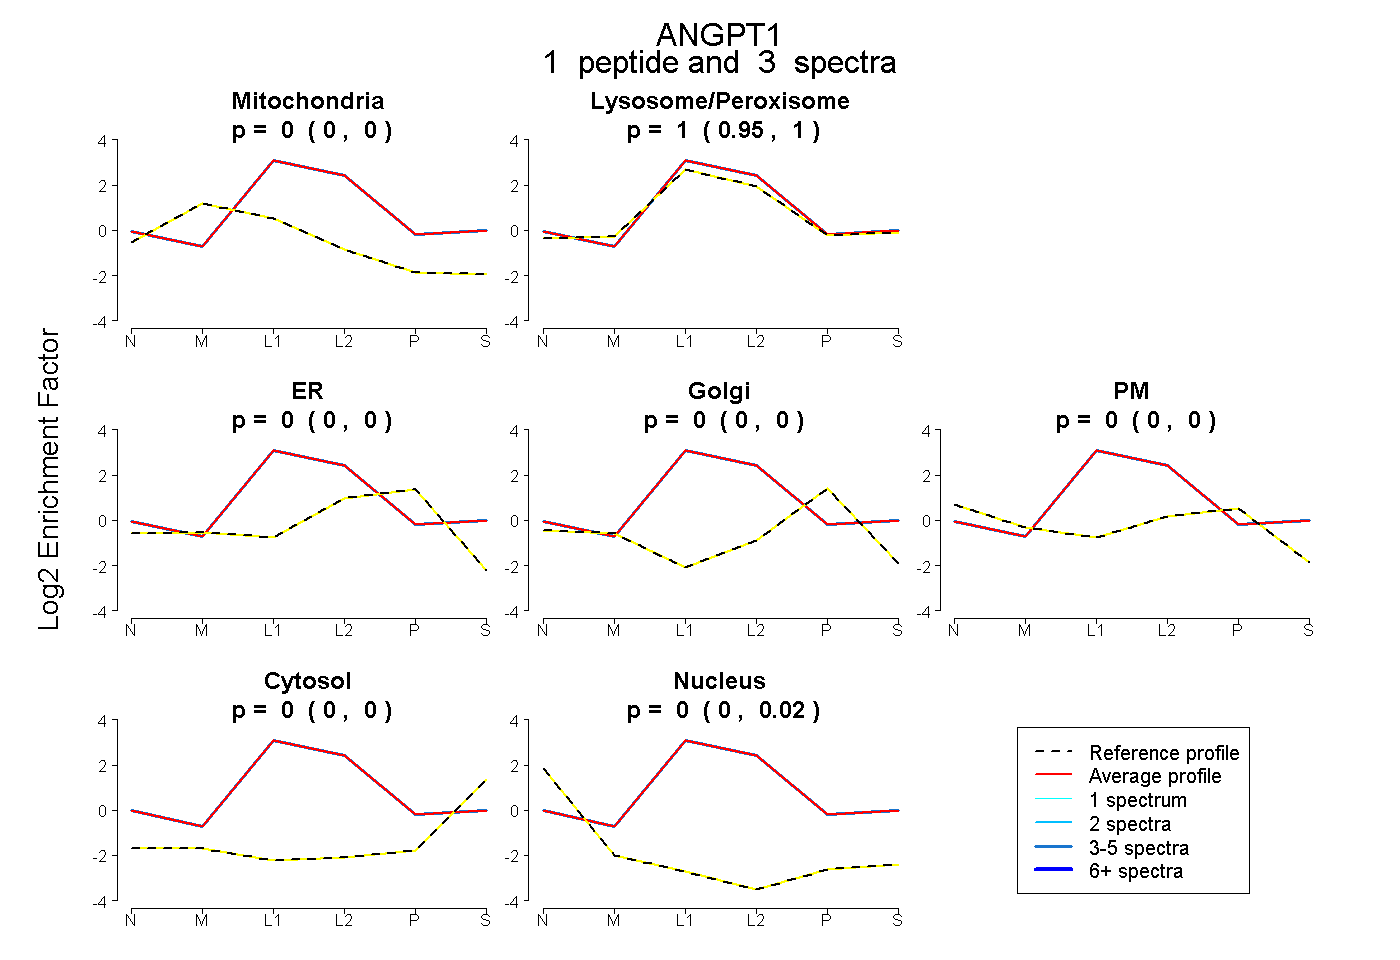
0.000 | 0.000
0.952 | 1.000
0.000 | 0.000
0.000 | 0.000
0.000 | 0.000
0.000 | 0.000
0.000 | 0.015
3peptides
spectra
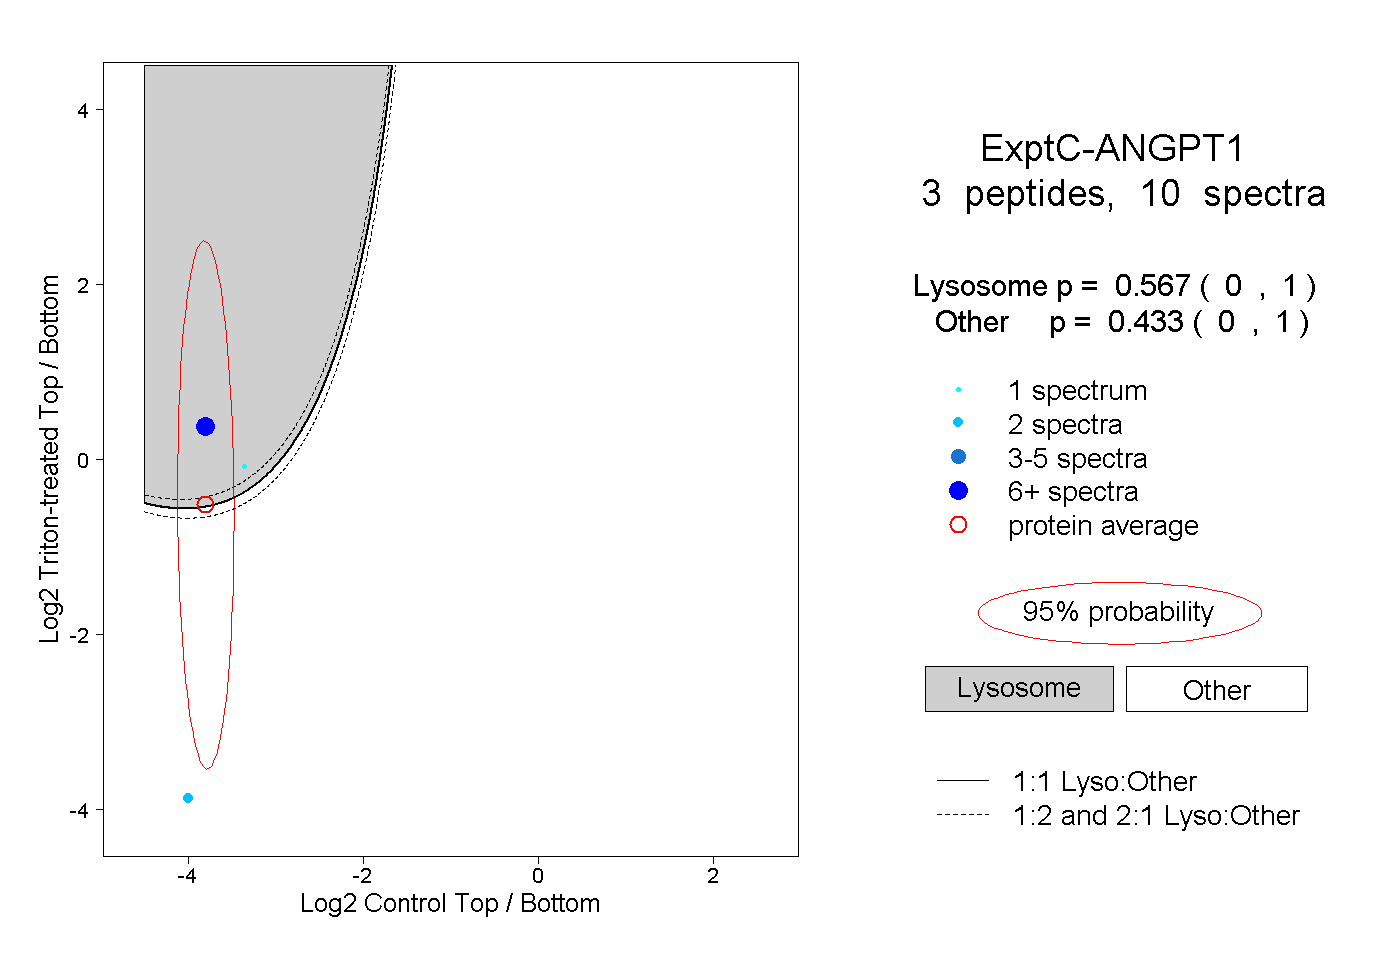
0.000 | 1.000
0.000 | 1.000
2peptides
spectra
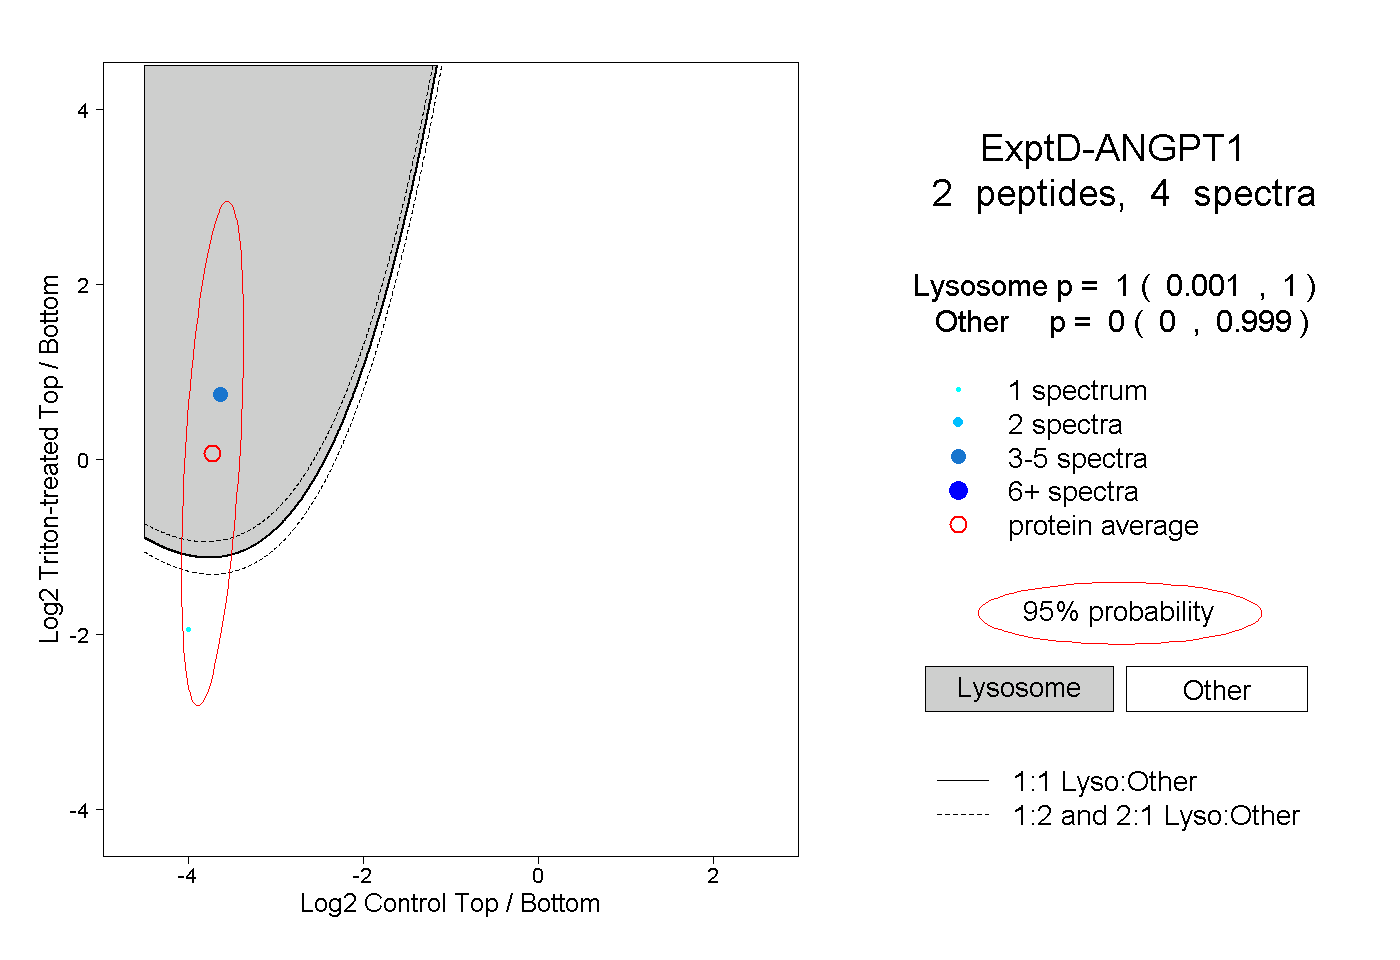
0.001 | 1.000
0.000 | 0.999