 4
4peptides
spectra
0.000 | 0.082
0.006 | 0.248
0.000 | 0.143
0.000 | 0.000
0.000 | 0.214
0.040 | 0.314
0.432 | 0.610
0.000 | 0.066
3peptides
spectra
0.000 | 0.001
0.999 | 1.000
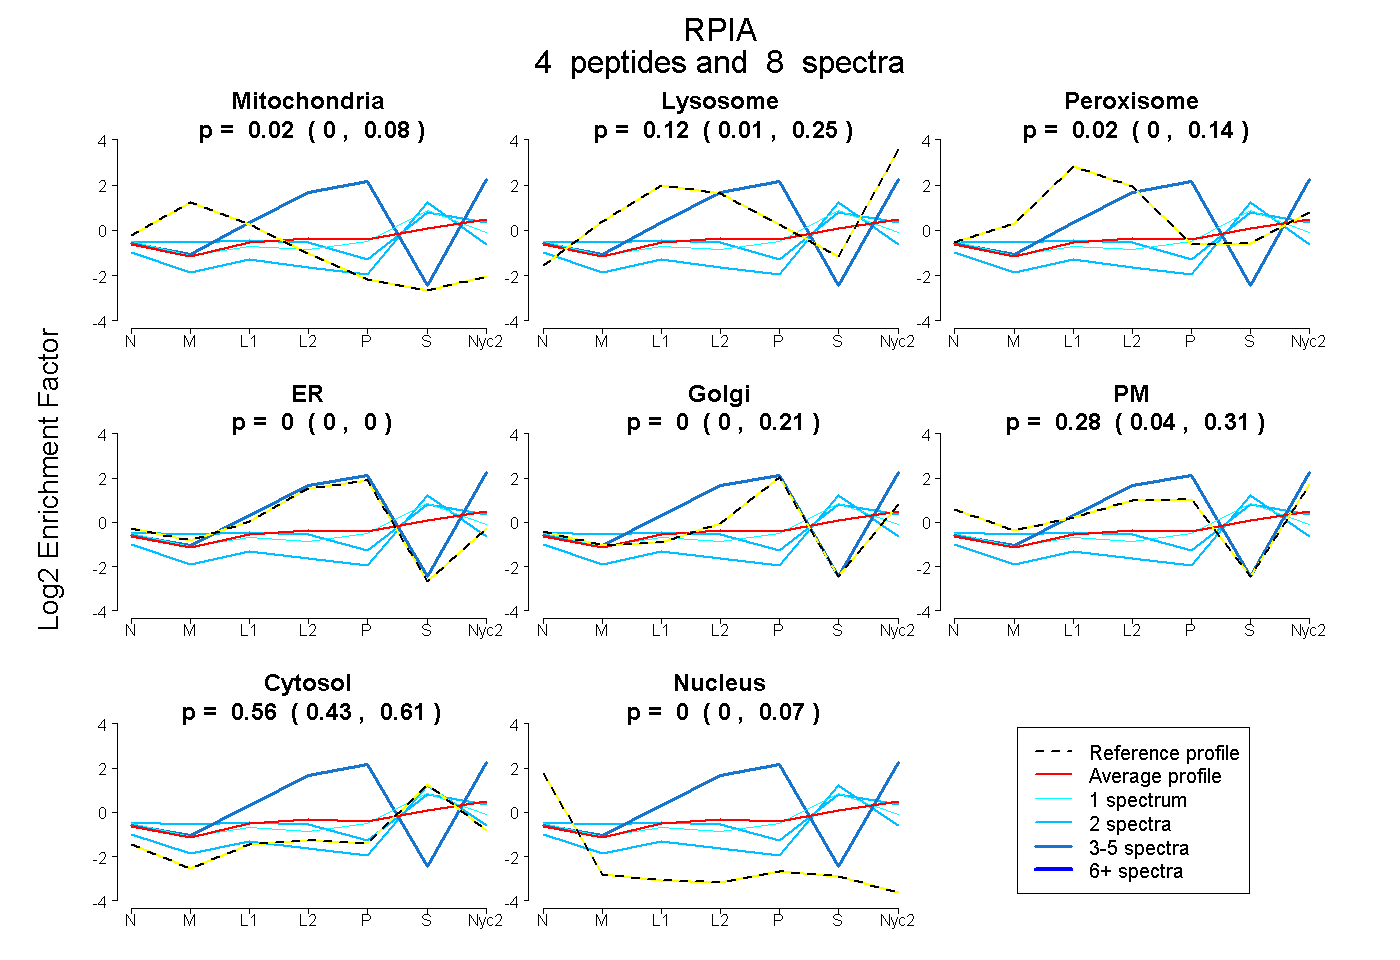
| Plot | Mito | Lyso | Perox | ER | Golgi | PM | Cytosol | Nucleus | |||||
| Expt A |
4 peptides |
8 spectra |
|
0.020 0.000 | 0.082 |
0.123 0.006 | 0.248 |
0.017 0.000 | 0.143 |
0.000 0.000 | 0.000 |
0.000 0.000 | 0.214 |
0.281 0.040 | 0.314 |
0.560 0.432 | 0.610 |
0.000 0.000 | 0.066 |
||
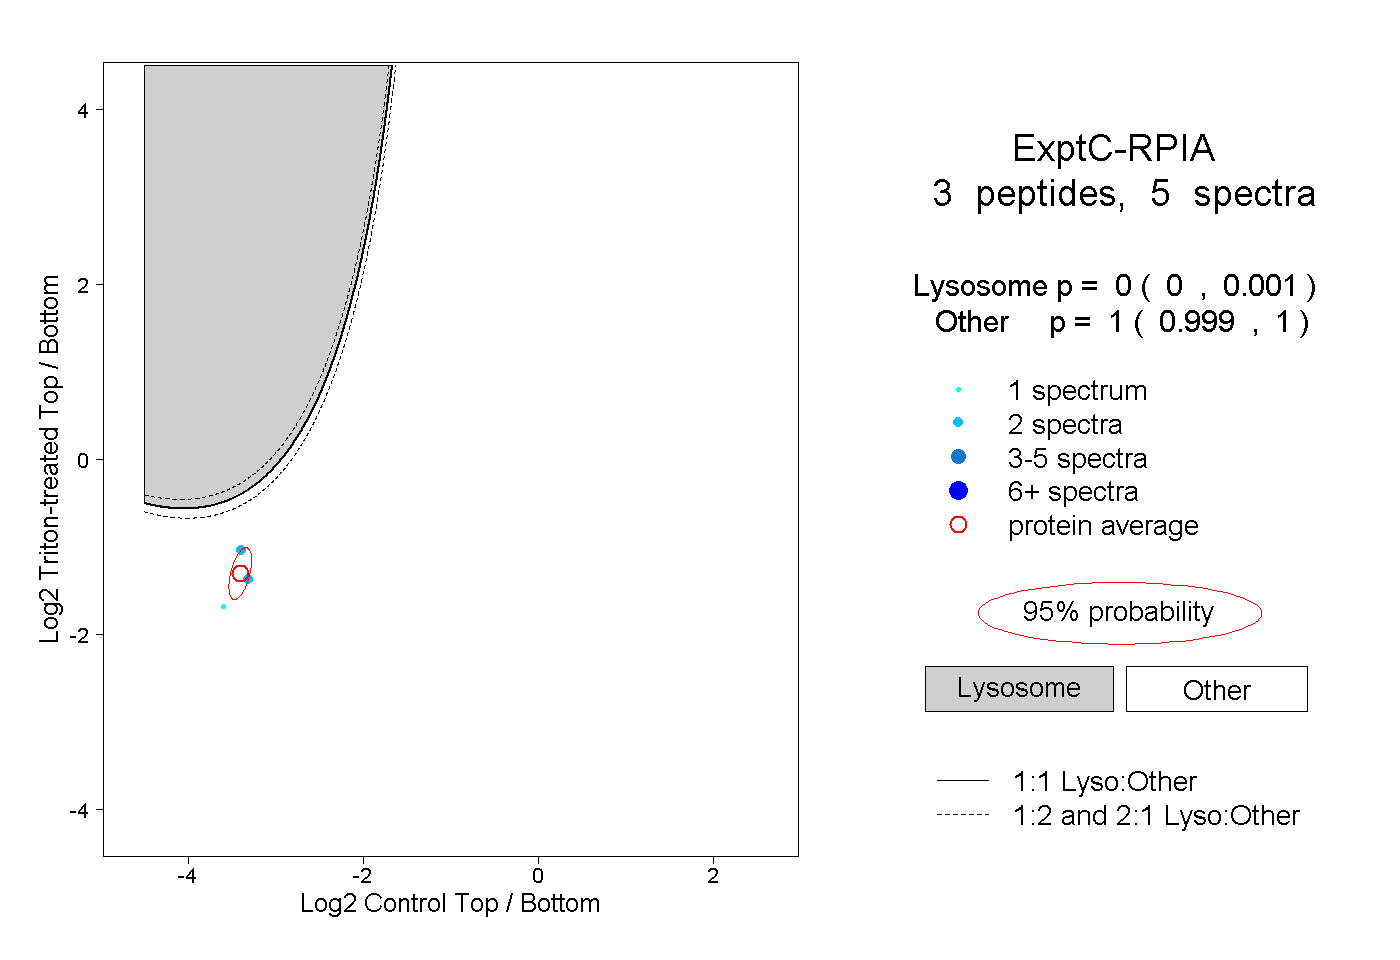
| Plot | Lyso | Other | |||||||||||
| Expt C |
3 peptides |
5 spectra |
|
0.000 0.000 | 0.001 |
1.000 0.999 | 1.000 |