 4
4peptides
spectra
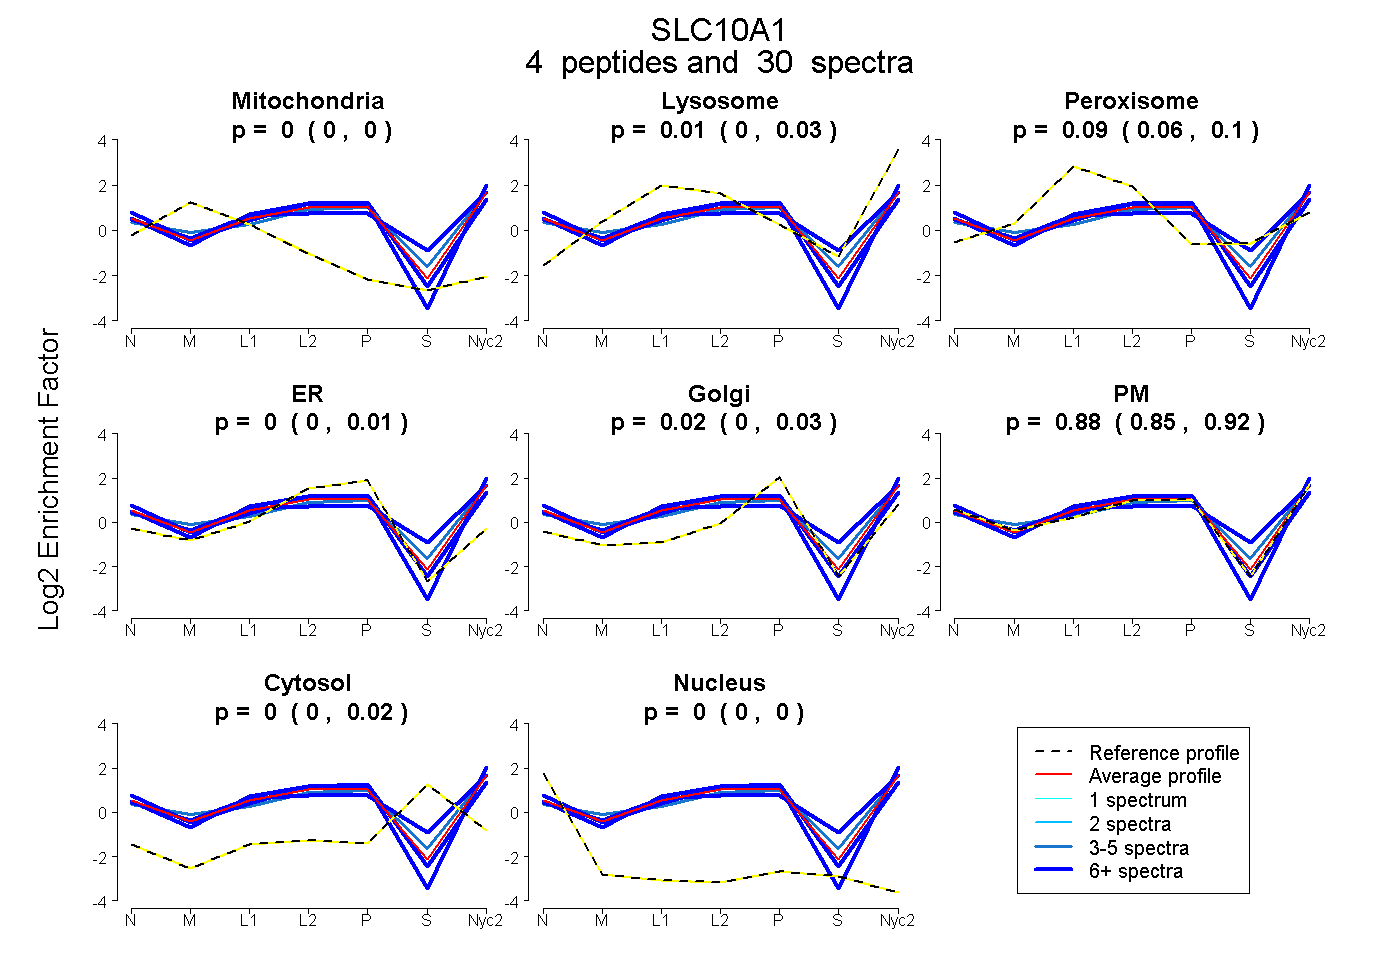
0.000 | 0.000
0.000 | 0.032
0.056 | 0.100
0.000 | 0.011
0.000 | 0.033
0.847 | 0.921
0.000 | 0.018
0.000 | 0.000
2peptides
spectra
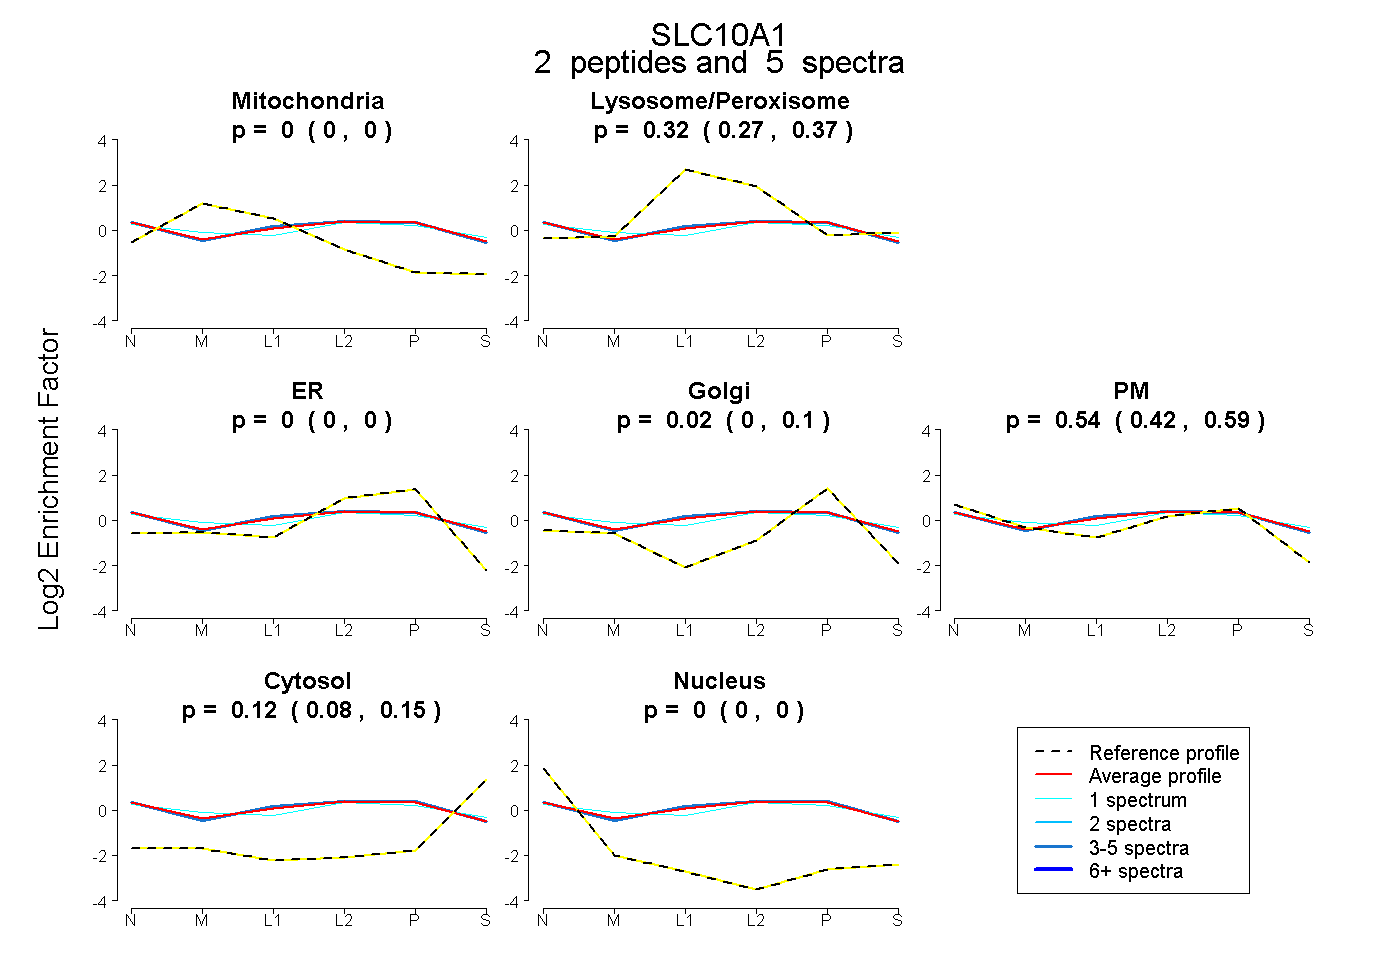
0.000 | 0.000
0.269 | 0.373
0.000 | 0.000
0.000 | 0.095
0.421 | 0.591
0.077 | 0.154
0.000 | 0.000
4peptides
spectra
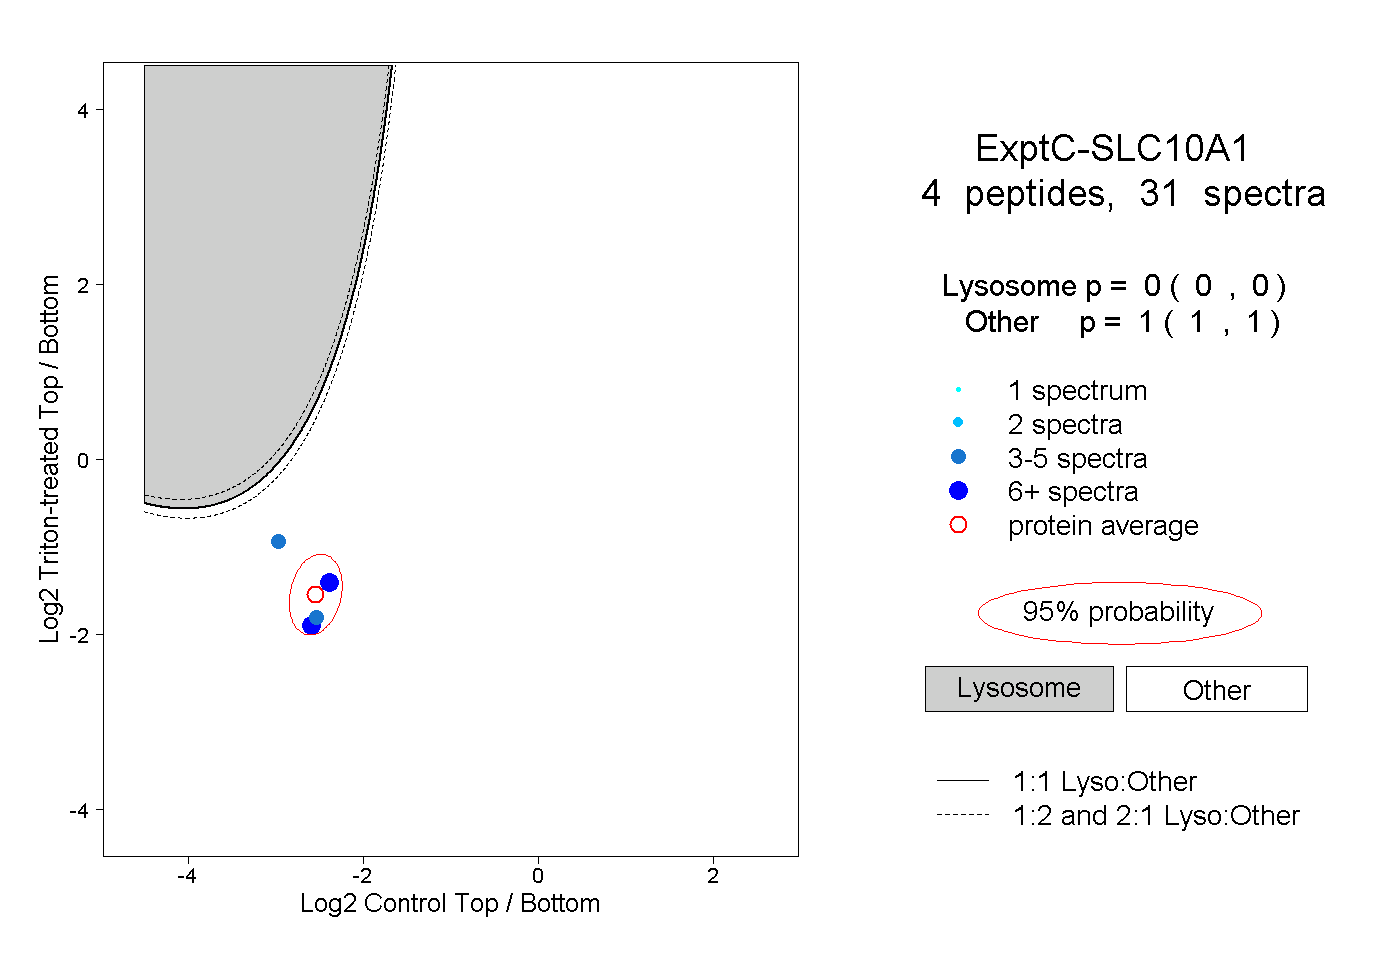
0.000 | 0.000
1.000 | 1.000
2peptides
spectra
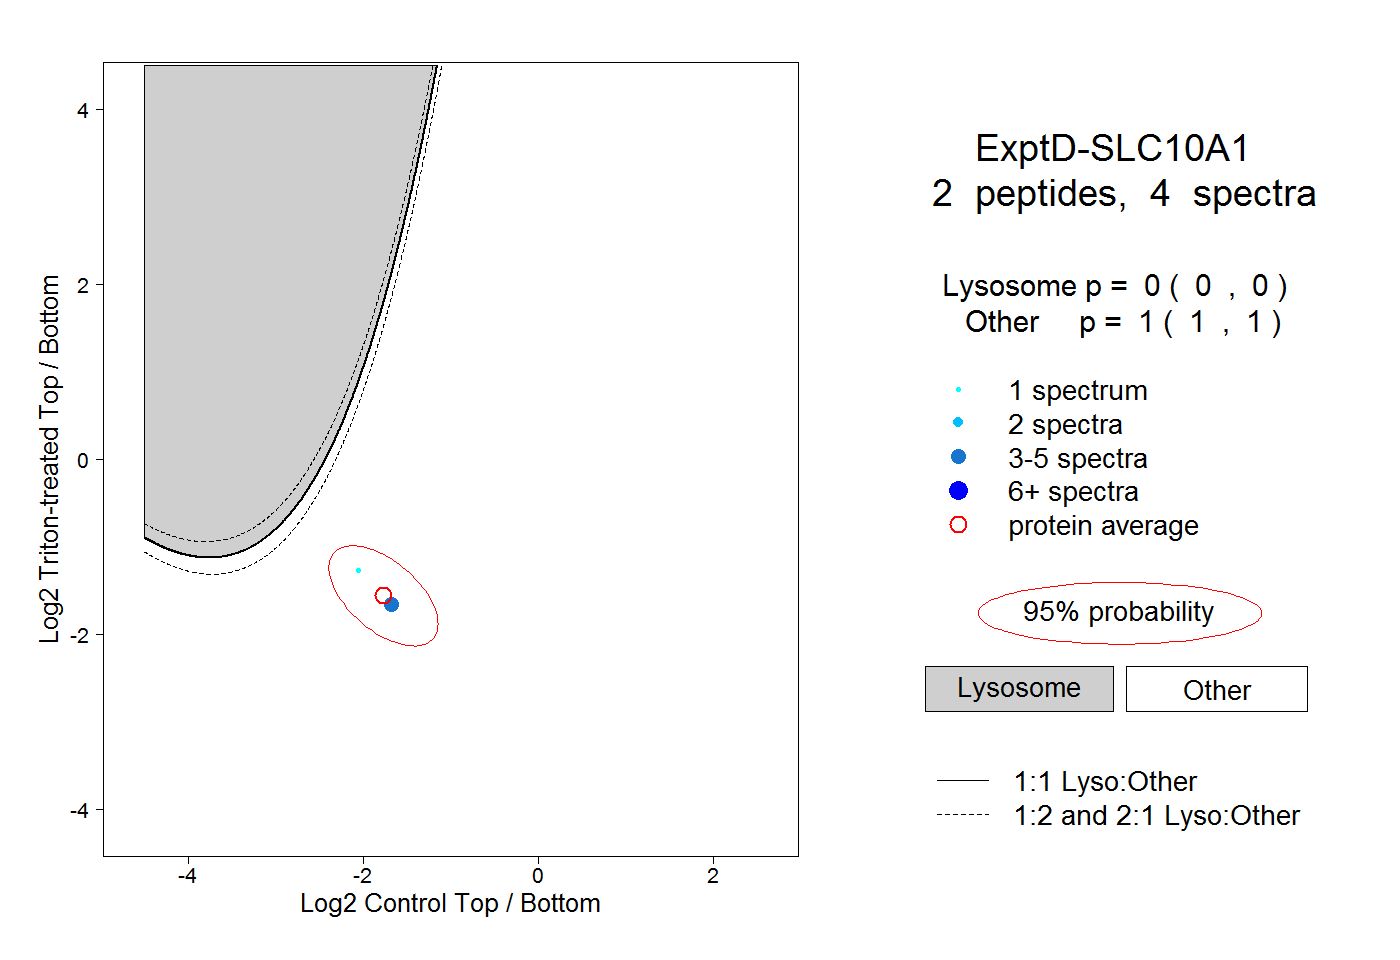
0.000 | 0.000
1.000 | 1.000