 1
1peptide
spectra
0.000 | 0.000
0.000 | 0.000
0.000 | 0.000
0.000 | 0.000
0.018 | 0.161
0.337 | 0.486
0.466 | 0.507
0.000 | 0.000
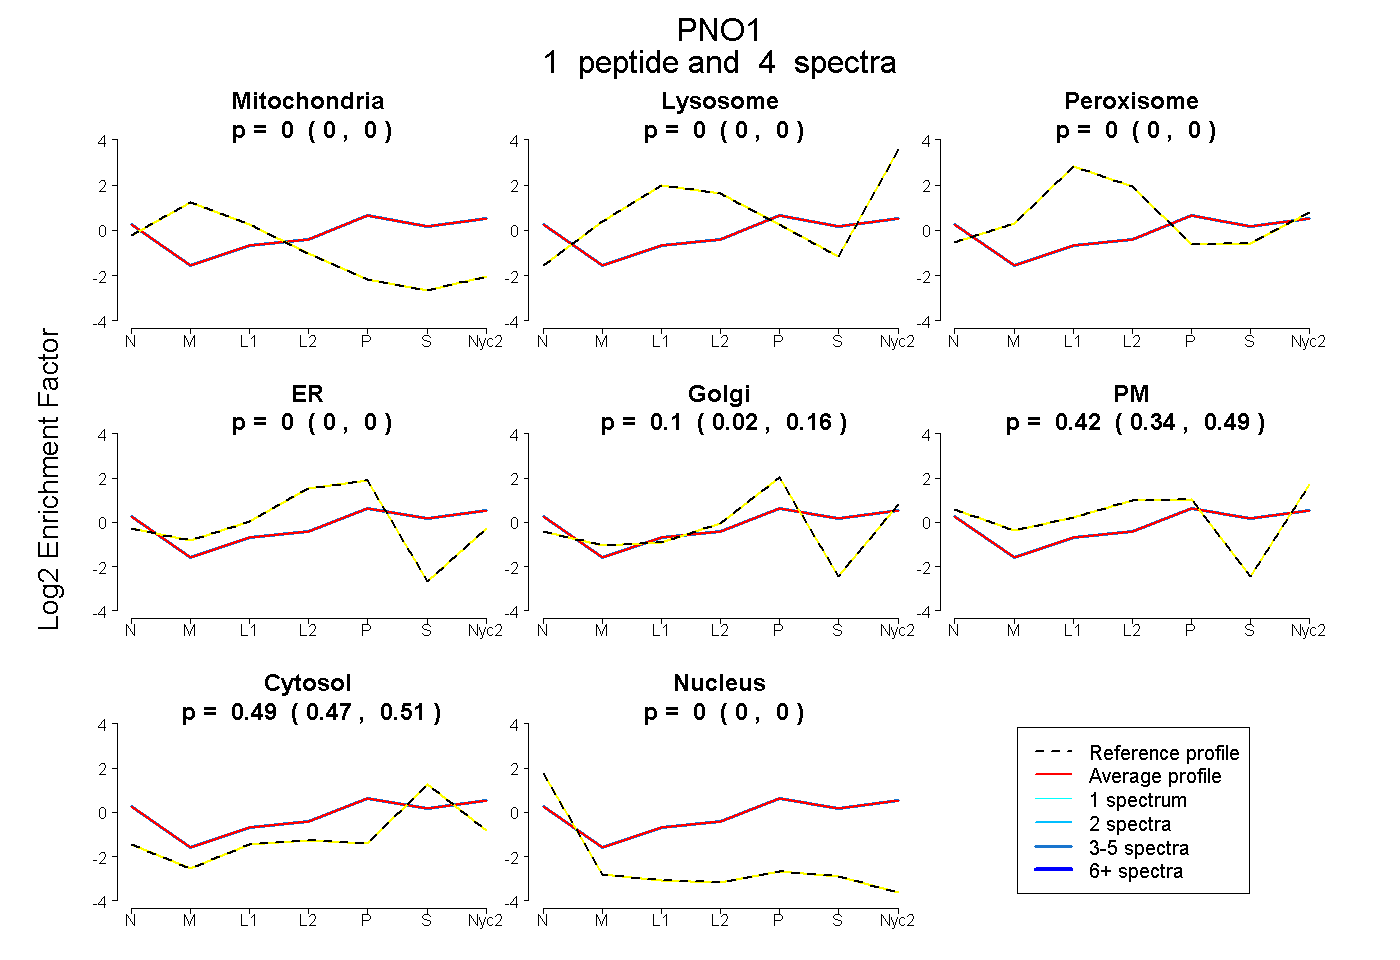
| Plot | Mito | Lyso | Perox | ER | Golgi | PM | Cytosol | Nucleus | |||||
| Expt A |
1 peptide |
4 spectra |
|
0.000 0.000 | 0.000 |
0.000 0.000 | 0.000 |
0.000 0.000 | 0.000 |
0.000 0.000 | 0.000 |
0.096 0.018 | 0.161 |
0.416 0.337 | 0.486 |
0.488 0.466 | 0.507 |
0.000 0.000 | 0.000 |