 6
6peptides
spectra
0.000 | 0.000
0.000 | 0.000
0.000 | 0.000
0.000 | 0.000
0.000 | 0.000
0.000 | 0.000
0.974 | 0.995
0.003 | 0.024
| Plot | Mito | Lyso | Perox | ER | Golgi | PM | Cytosol | Nucleus | |||||
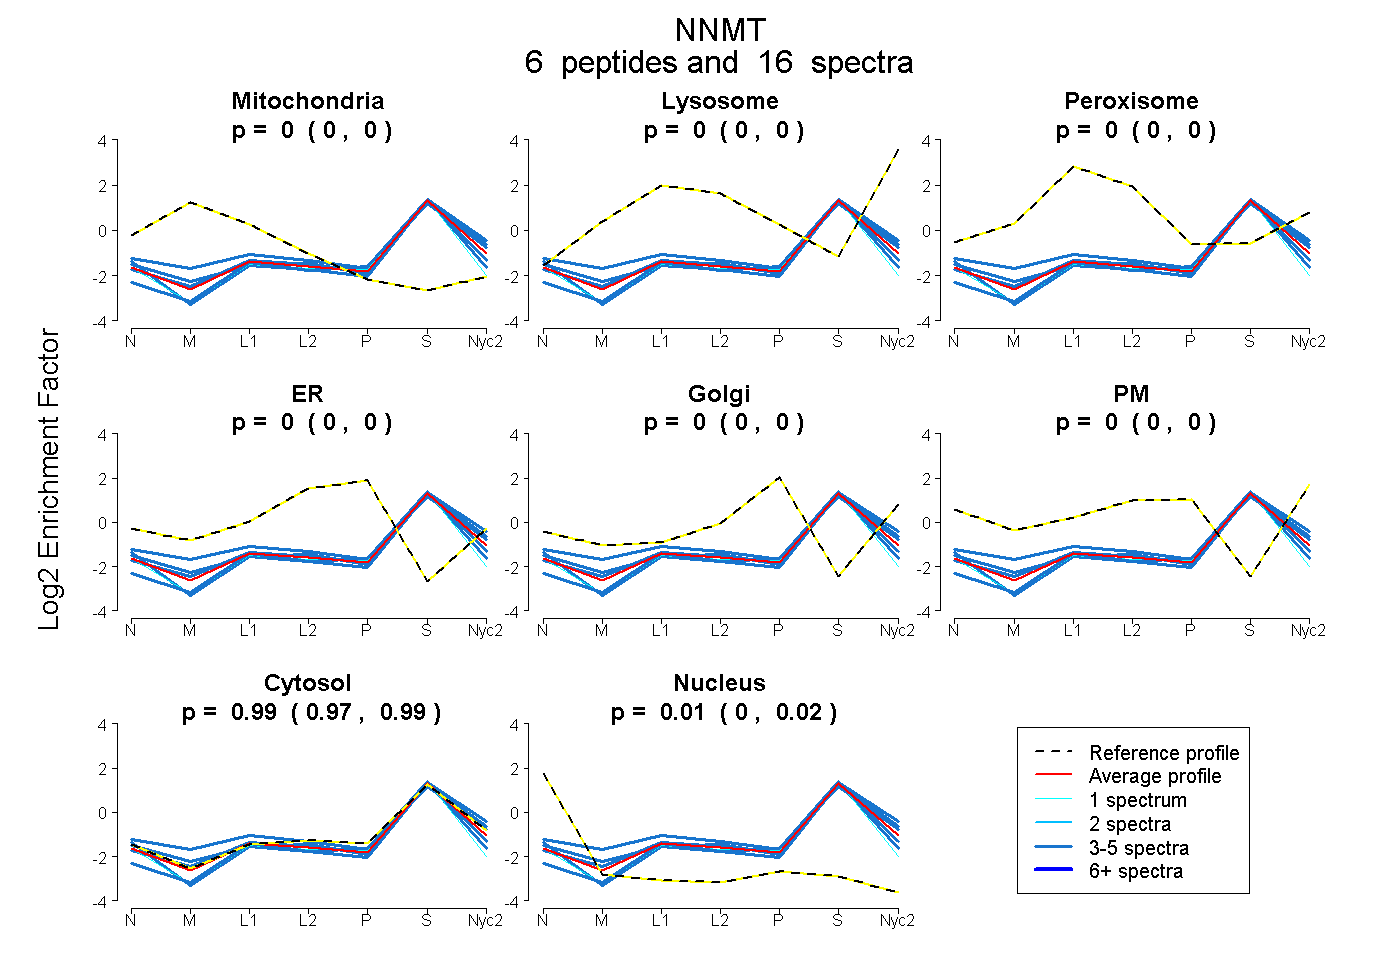
| Expt A |
6 peptides |
16 spectra |
|
0.000 0.000 | 0.000 |
0.000 0.000 | 0.000 |
0.000 0.000 | 0.000 |
0.000 0.000 | 0.000 |
0.000 0.000 | 0.000 |
0.000 0.000 | 0.000 |
0.985 0.974 | 0.995 |
0.015 0.003 | 0.024 |
| 3 spectra, HCAENEILR | 0.102 | 0.000 | 0.036 | 0.000 | 0.000 | 0.000 | 0.862 | 0.000 | ||
| 1 spectrum, KPVGSE | 0.000 | 0.000 | 0.000 | 0.000 | 0.000 | 0.000 | 0.918 | 0.082 | ||
| 3 spectra, IFCLDGVK | 0.000 | 0.000 | 0.000 | 0.000 | 0.000 | 0.000 | 0.923 | 0.077 | ||
| 3 spectra, SSYYMIGEQK | 0.000 | 0.000 | 0.000 | 0.000 | 0.000 | 0.000 | 1.000 | 0.000 | ||
| 3 spectra, FSSLSLDR | 0.016 | 0.000 | 0.000 | 0.000 | 0.000 | 0.000 | 0.975 | 0.010 | ||
| 3 spectra, DTYLSHFNPR | 0.000 | 0.012 | 0.000 | 0.000 | 0.000 | 0.000 | 0.988 | 0.000 |
| Plot | Mito | Lyso or Perox | ER | Golgi | PM | Cytosol | Nucleus | ||||||
| Expt B |
3 peptides |
11 spectra |
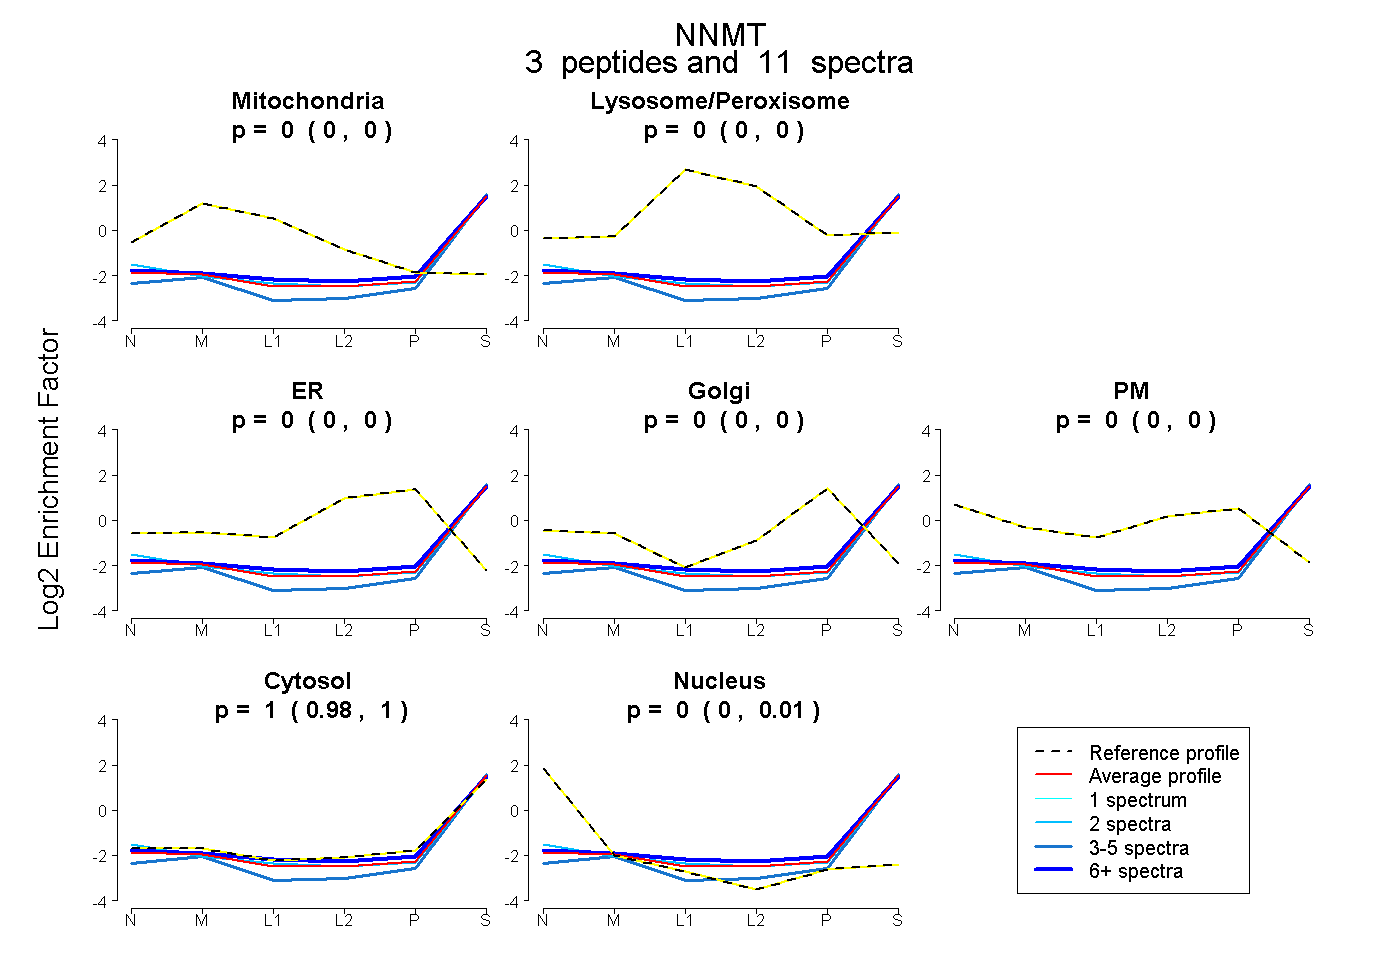 |
0.000 0.000 | 0.000 |
0.000 0.000 | 0.000 |
0.000 0.000 | 0.000 |
0.000 0.000 | 0.000 |
0.000 0.000 | 0.000 |
0.998 0.983 | 1.000 |
0.002 0.000 | 0.015 |
|||
| Plot | Lyso | Other | |||||||||||
| Expt C |
6 peptides |
22 spectra |
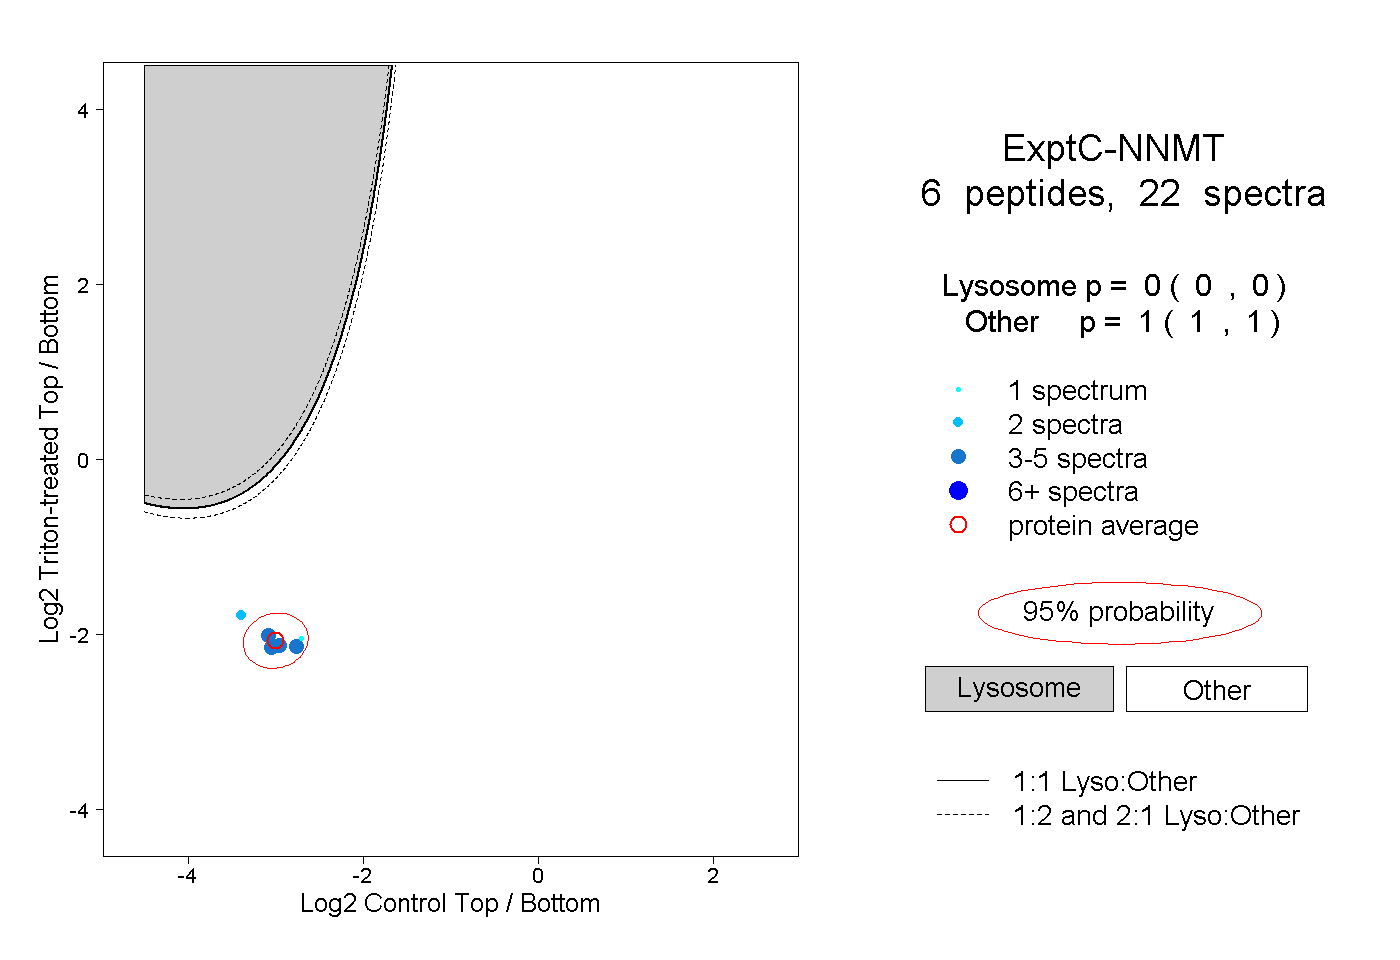 |
0.000 0.000 | 0.000 |
1.000 1.000 | 1.000 |
||||||||
| Plot | Lyso | Other | |||||||||||
| Expt D |
1 peptide |
1 spectrum |
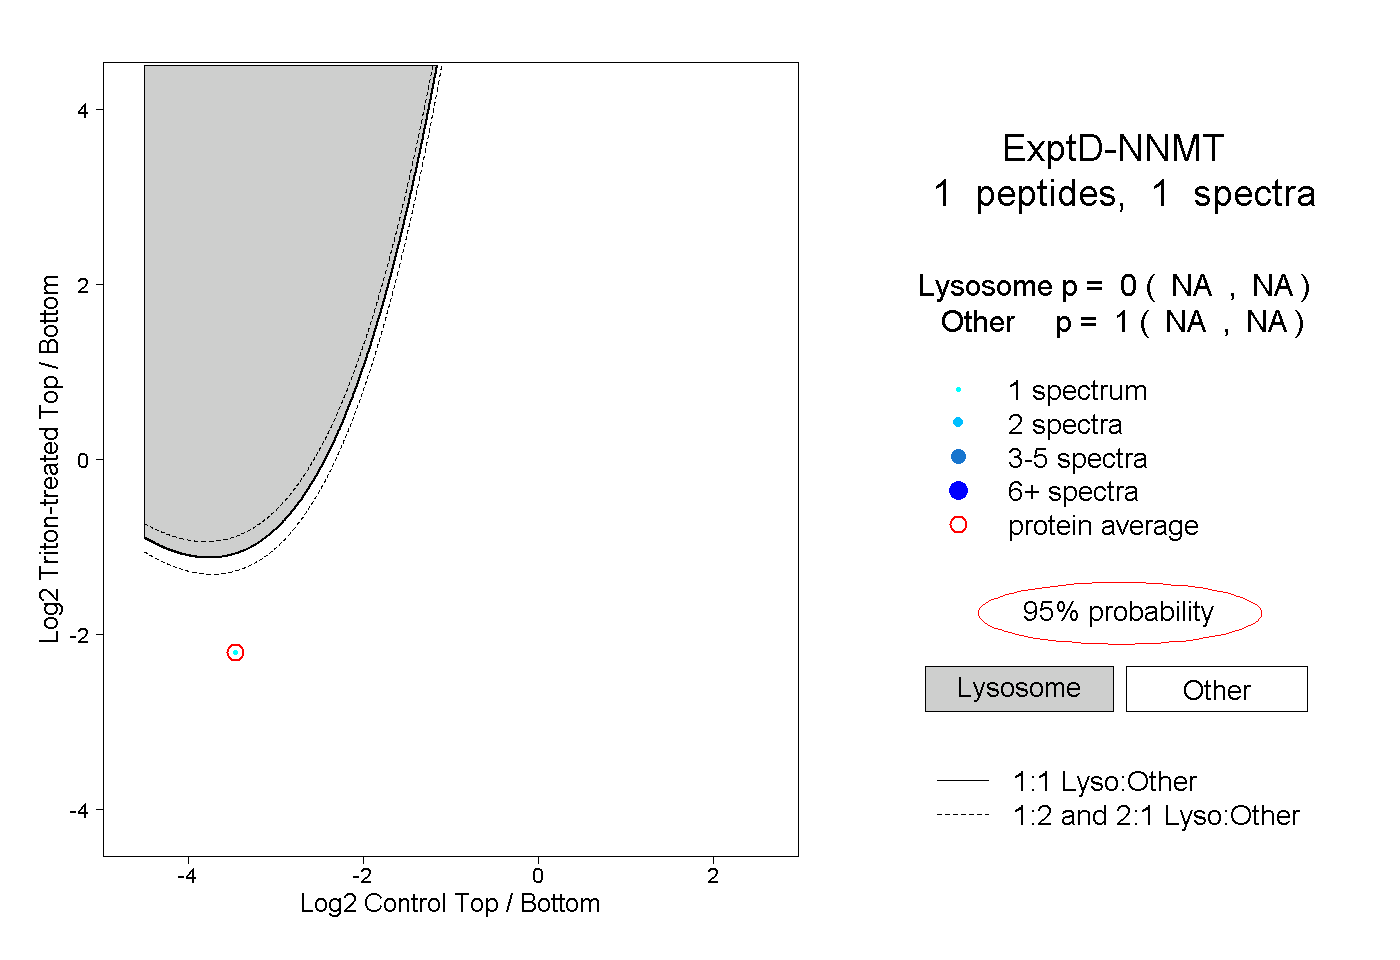 |
0.000 NA | NA |
1.000 NA | NA |