8
8peptides
spectra
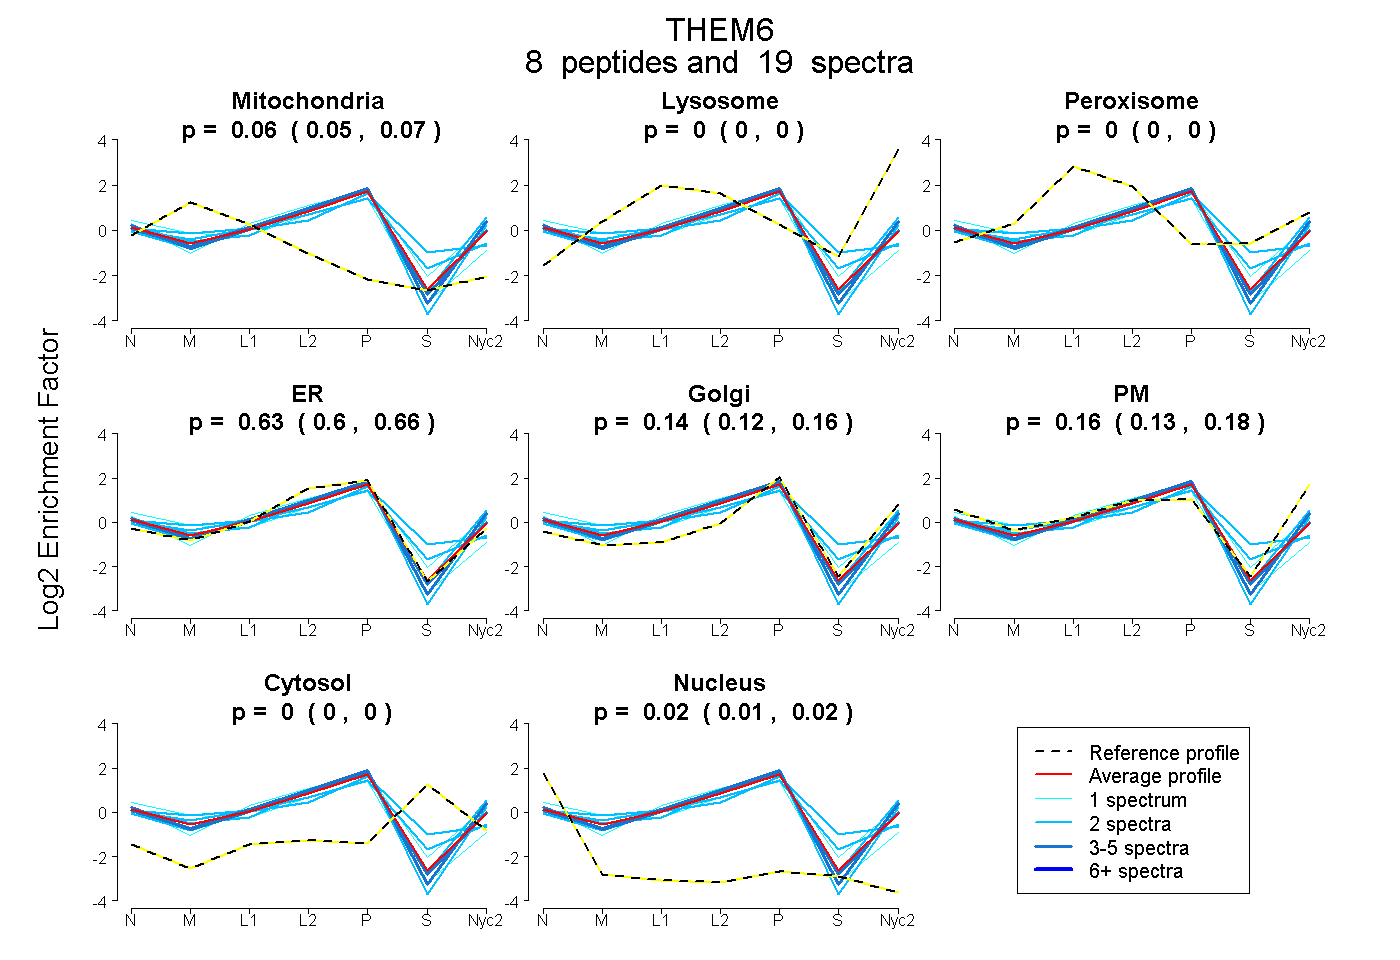
0.046 | 0.065
0.000 | 0.000
0.000 | 0.000
0.598 | 0.655
0.122 | 0.163
0.128 | 0.176
0.000 | 0.000
0.009 | 0.023
5peptides
spectra
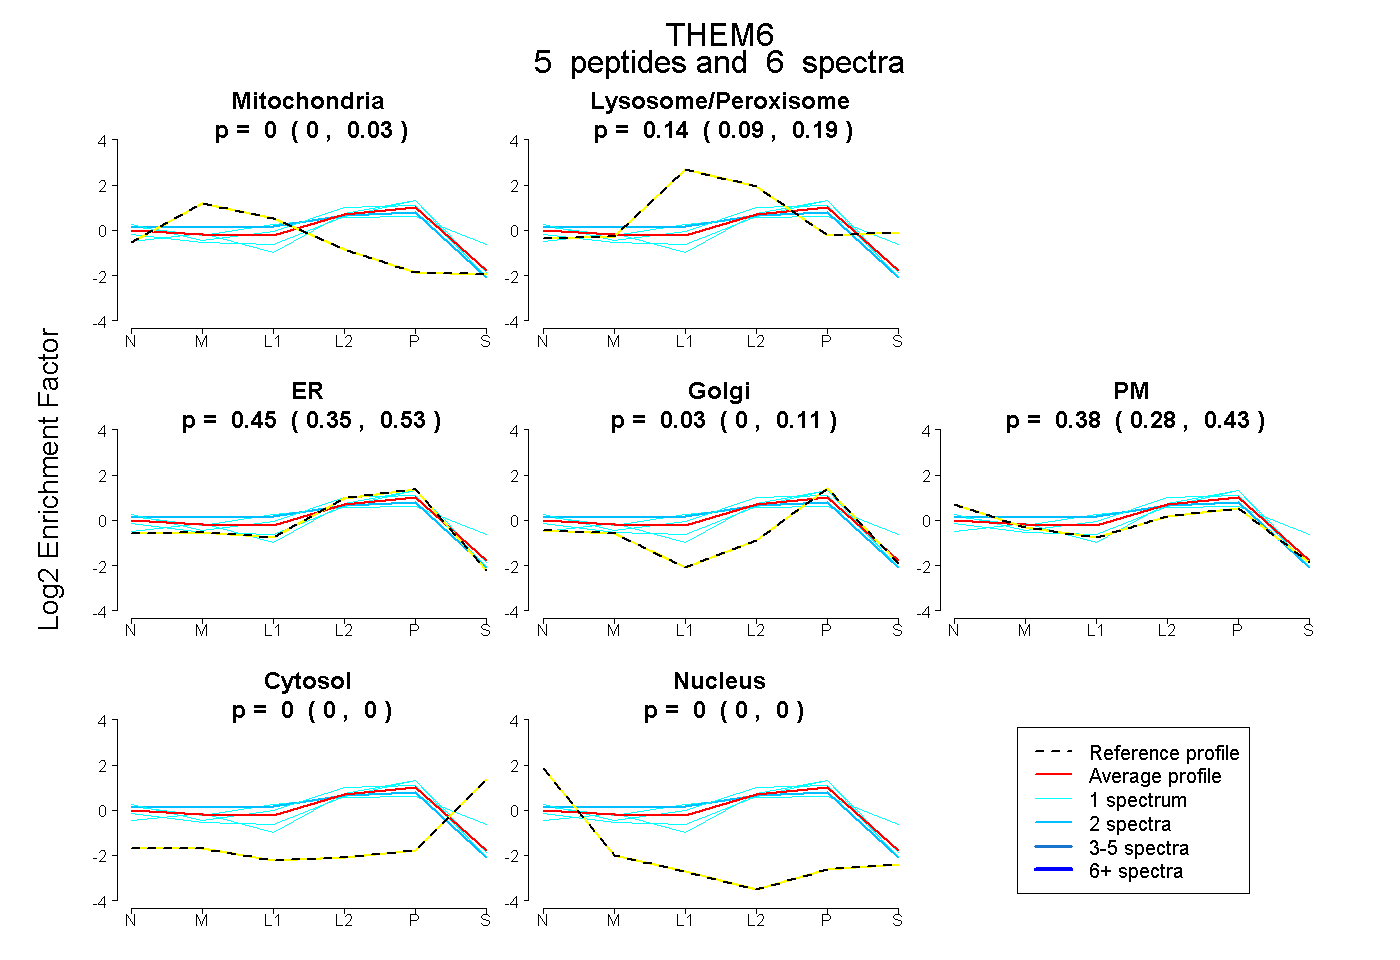
0.000 | 0.033
0.091 | 0.194
0.348 | 0.528
0.000 | 0.109
0.285 | 0.429
0.000 | 0.000
0.000 | 0.000