 8
8peptides
spectra
0.046 | 0.065
0.000 | 0.000
0.000 | 0.000
0.598 | 0.655
0.122 | 0.163
0.128 | 0.176
0.000 | 0.000
0.009 | 0.023
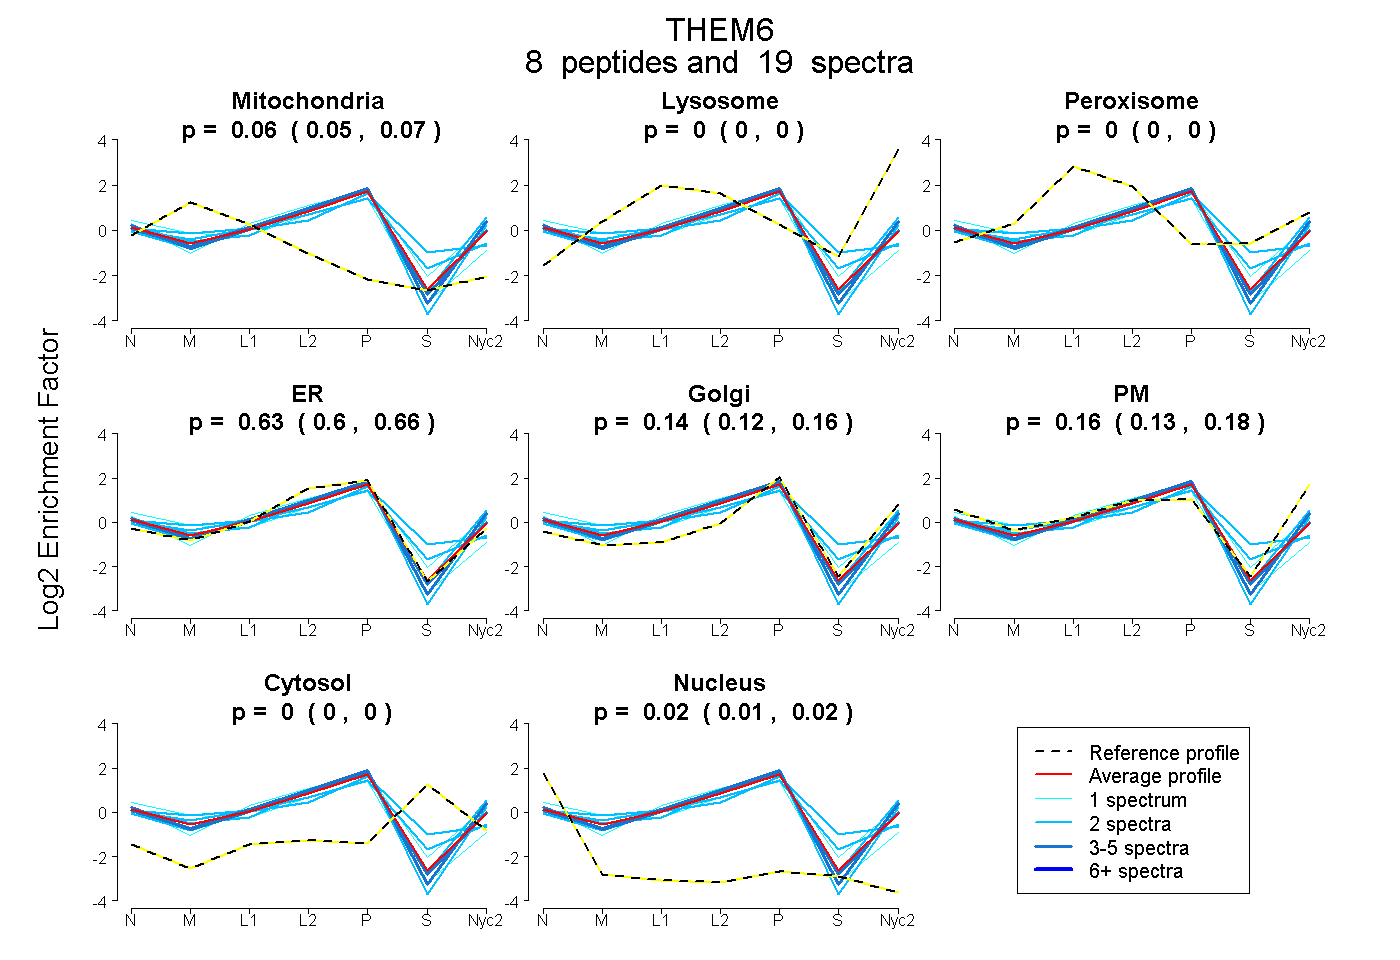
| Plot | Mito | Lyso | Perox | ER | Golgi | PM | Cytosol | Nucleus | |||||
| Expt A |
8 peptides |
19 spectra |
|
0.057 0.046 | 0.065 |
0.000 0.000 | 0.000 |
0.000 0.000 | 0.000 |
0.627 0.598 | 0.655 |
0.144 0.122 | 0.163 |
0.155 0.128 | 0.176 |
0.000 0.000 | 0.000 |
0.016 0.009 | 0.023 |
| 2 spectra, DLGAHTVLAASCAR | 0.135 | 0.000 | 0.082 | 0.578 | 0.148 | 0.000 | 0.056 | 0.000 | ||
| 1 spectrum, CGVLGALR | 0.150 | 0.000 | 0.000 | 0.770 | 0.000 | 0.014 | 0.000 | 0.066 | ||
| 2 spectra, LFEPFEVHTR | 0.012 | 0.000 | 0.000 | 0.428 | 0.222 | 0.337 | 0.000 | 0.002 | ||
| 2 spectra, DGFVCALLR | 0.000 | 0.000 | 0.061 | 0.626 | 0.079 | 0.000 | 0.234 | 0.000 | ||
| 2 spectra, DLLAEQLYAGR | 0.042 | 0.000 | 0.000 | 0.625 | 0.127 | 0.206 | 0.000 | 0.000 | ||
| 5 spectra, VLPSDLDLLLHMNNAR | 0.018 | 0.000 | 0.000 | 0.702 | 0.074 | 0.180 | 0.000 | 0.026 | ||
| 1 spectrum, AESGLSDR | 0.000 | 0.000 | 0.022 | 0.615 | 0.015 | 0.288 | 0.060 | 0.000 | ||
| 4 spectra, LLGWDDR | 0.000 | 0.000 | 0.000 | 0.579 | 0.142 | 0.268 | 0.000 | 0.011 |
| Plot | Mito | Lyso or Perox | ER | Golgi | PM | Cytosol | Nucleus | ||||||
| Expt B |
5 peptides |
6 spectra |
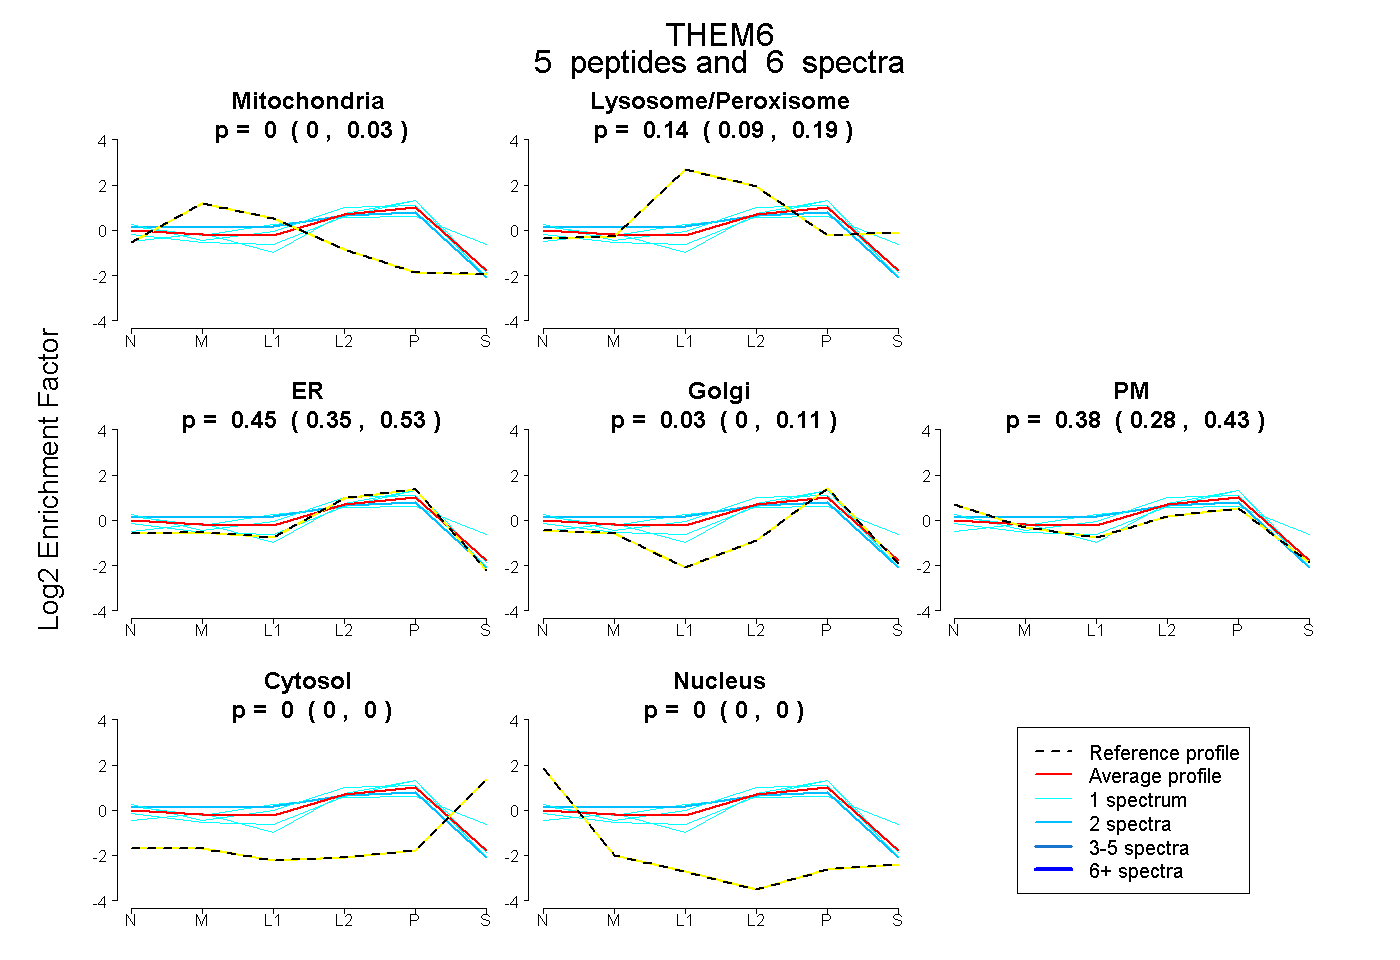 |
0.000 0.000 | 0.033 |
0.143 0.091 | 0.194 |
0.450 0.348 | 0.528 |
0.027 0.000 | 0.109 |
0.380 0.285 | 0.429 |
0.000 0.000 | 0.000 |
0.000 0.000 | 0.000 |
|||
| Plot | Lyso | Other | |||||||||||
| Expt C |
7 peptides |
17 spectra |
 |
0.000 0.000 | 0.000 |
1.000 1.000 | 1.000 |
||||||||
| Plot | Lyso | Other | |||||||||||
| Expt D |
2 peptides |
3 spectra |
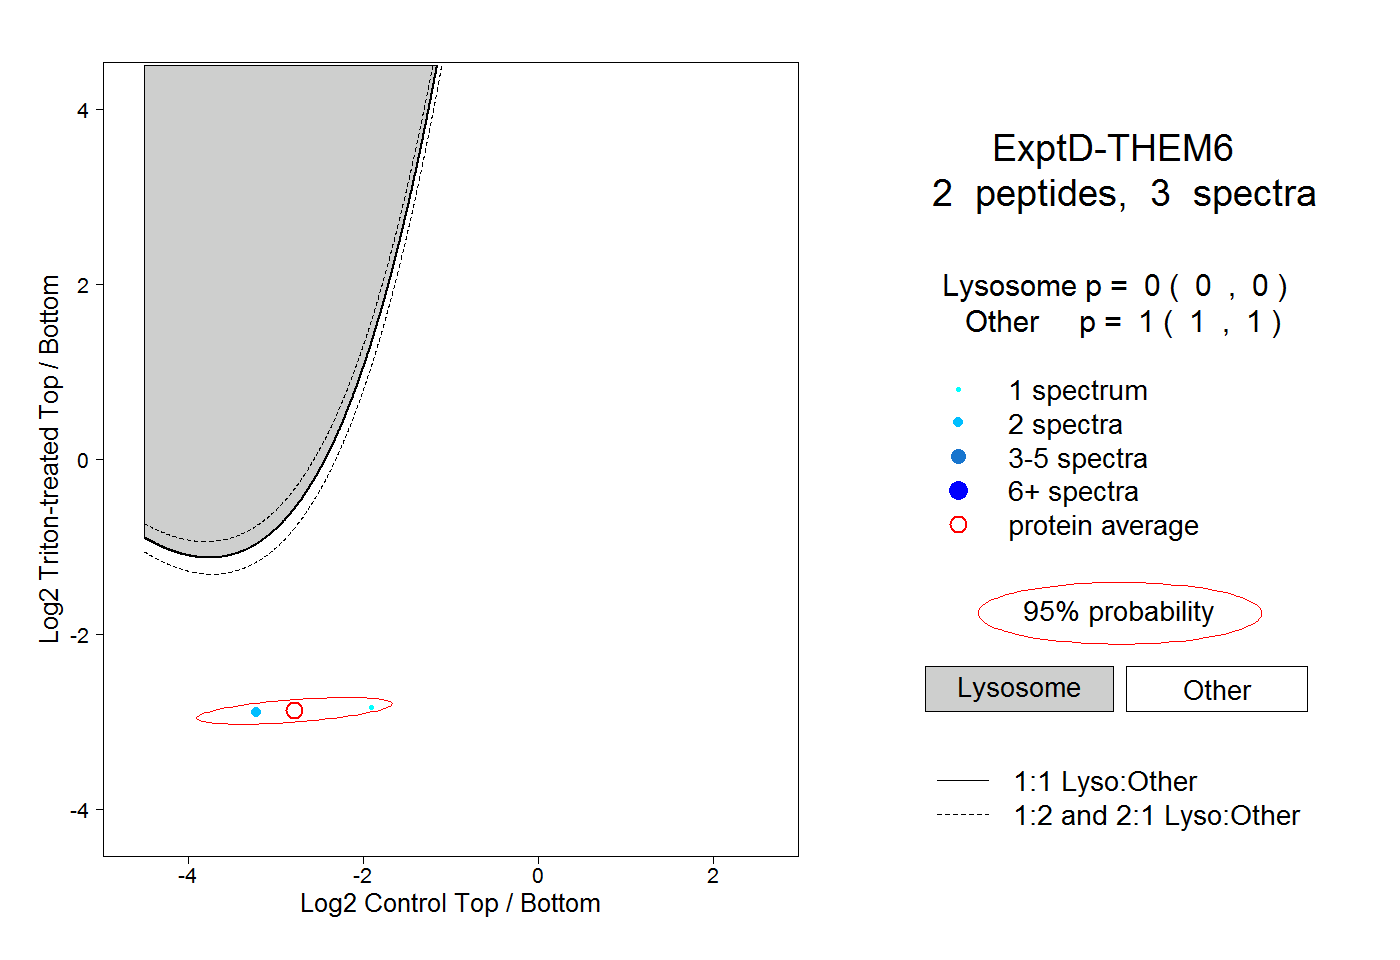 |
0.000 0.000 | 0.000 |
1.000 1.000 | 1.000 |