 7
7peptides
spectra
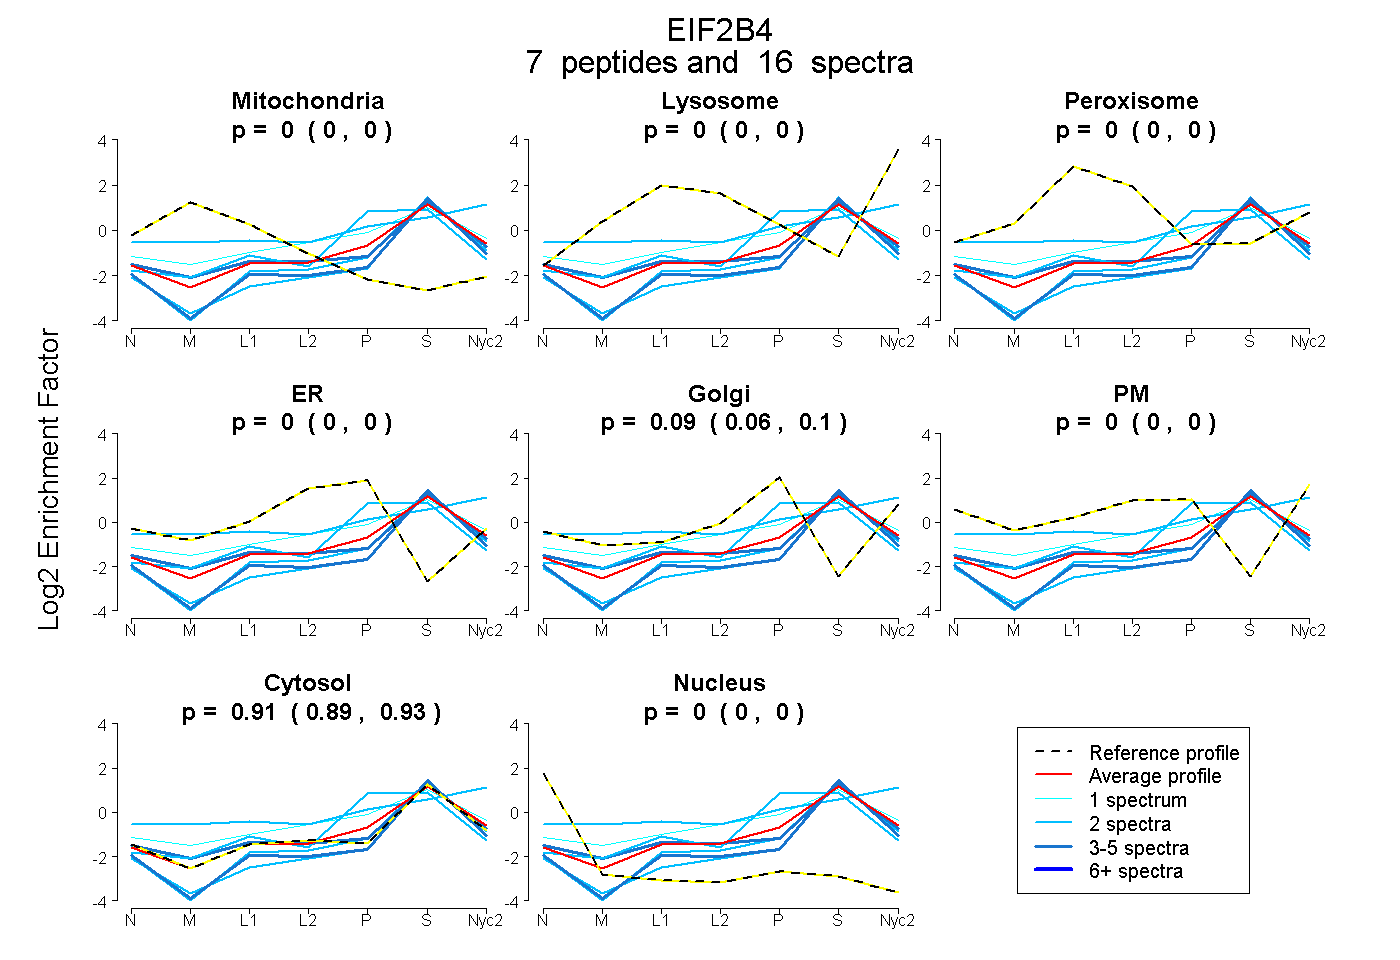
0.000 | 0.000
0.000 | 0.000
0.000 | 0.000
0.000 | 0.000
0.062 | 0.105
0.000 | 0.000
0.890 | 0.934
0.000 | 0.000
3peptides
spectra
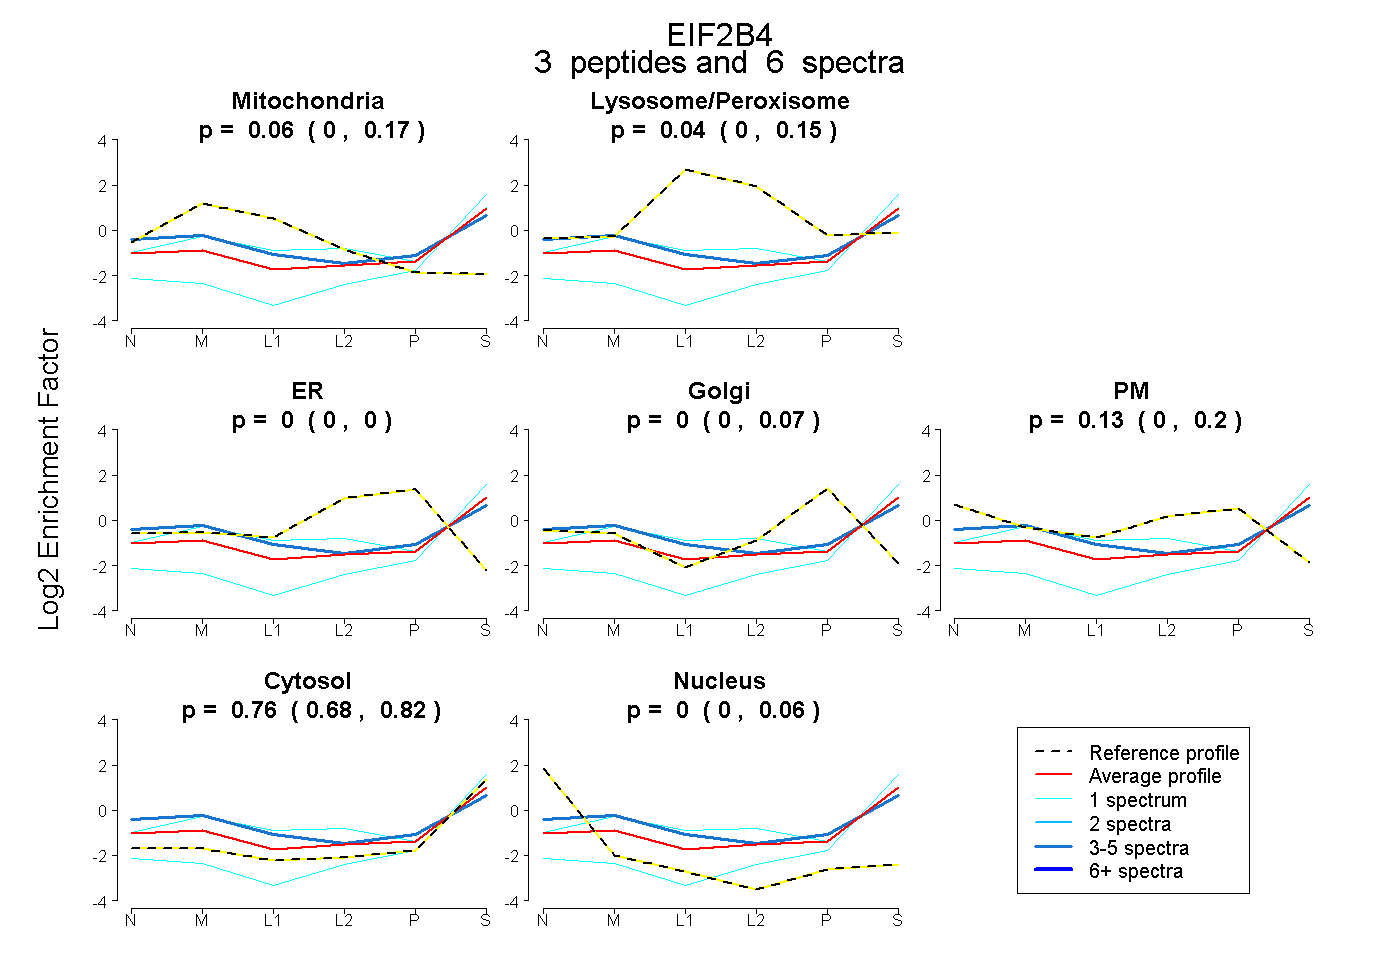
0.000 | 0.168
0.000 | 0.148
0.000 | 0.000
0.000 | 0.066
0.000 | 0.198
0.680 | 0.820
0.000 | 0.057
5peptides
spectra
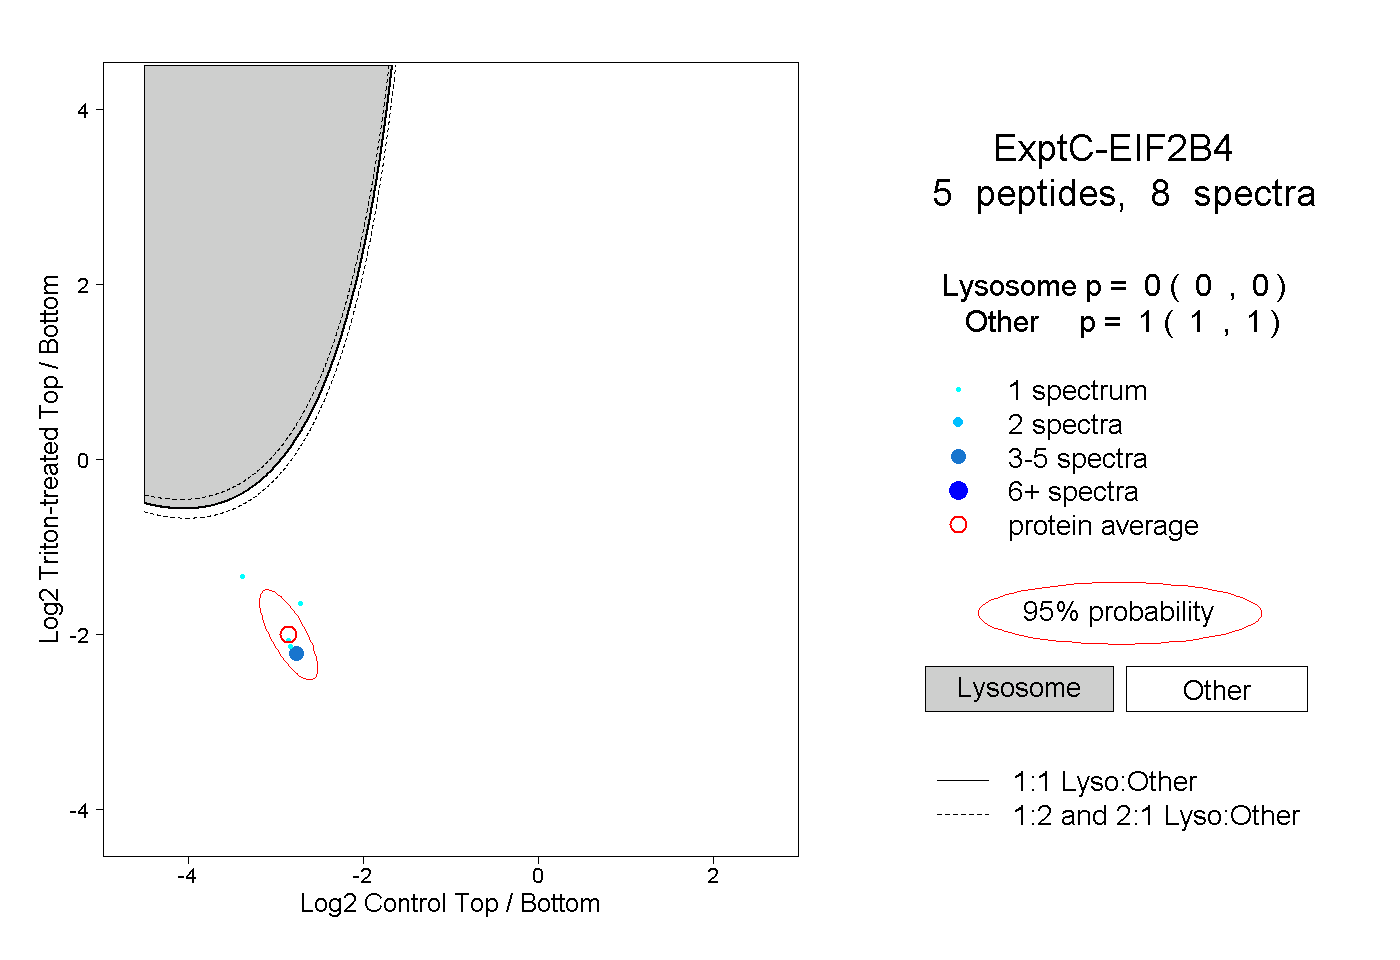
0.000 | 0.000
1.000 | 1.000