 18
18peptides
spectra
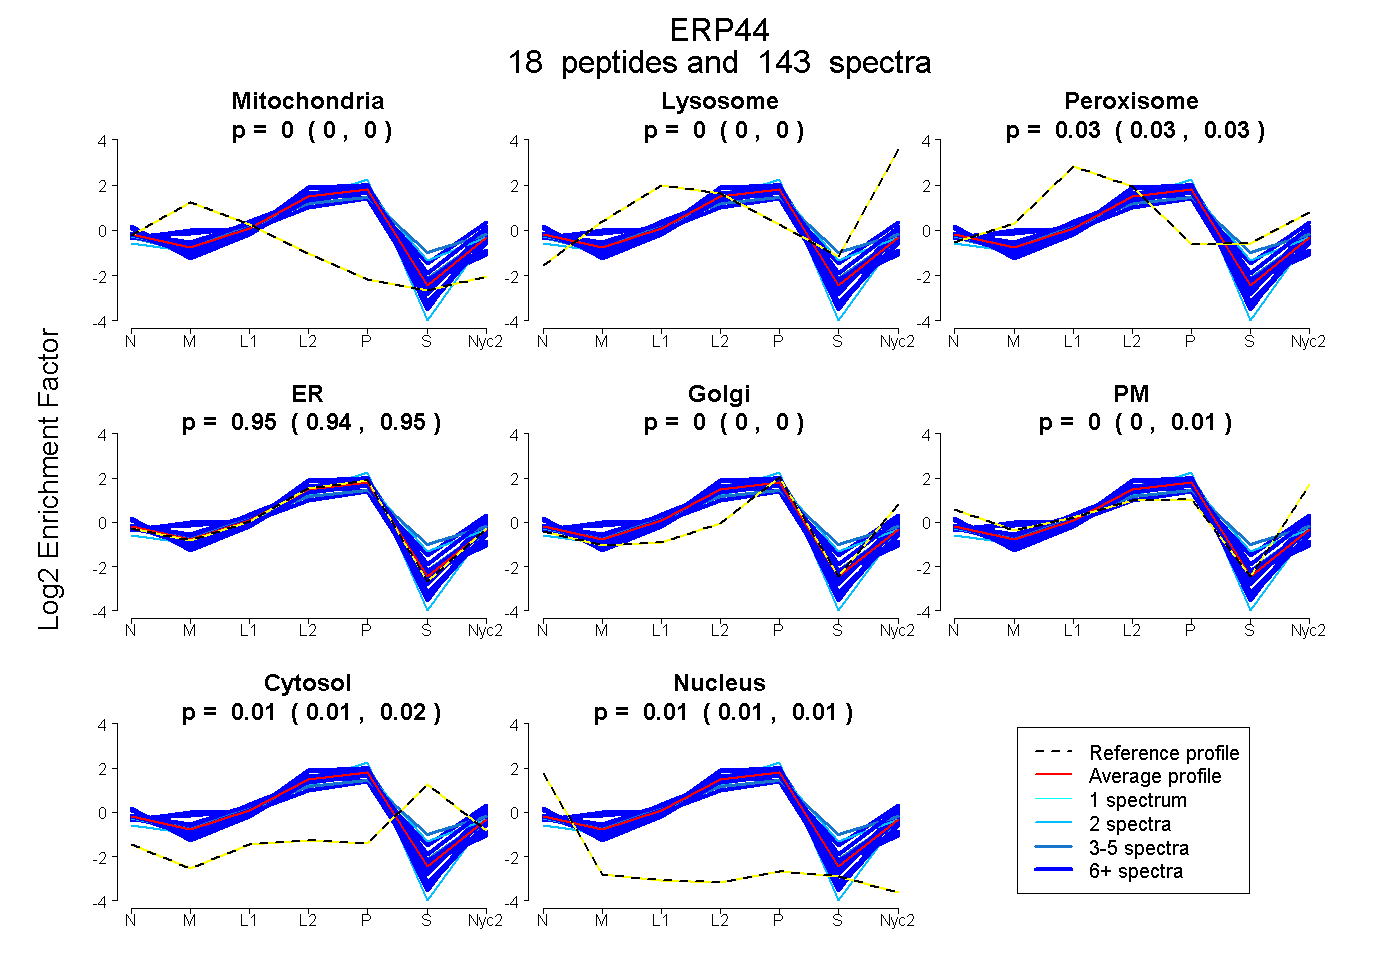
0.000 | 0.000
0.000 | 0.000
0.029 | 0.033
0.941 | 0.949
0.000 | 0.000
0.000 | 0.006
0.008 | 0.017
0.006 | 0.011
12peptides
spectra
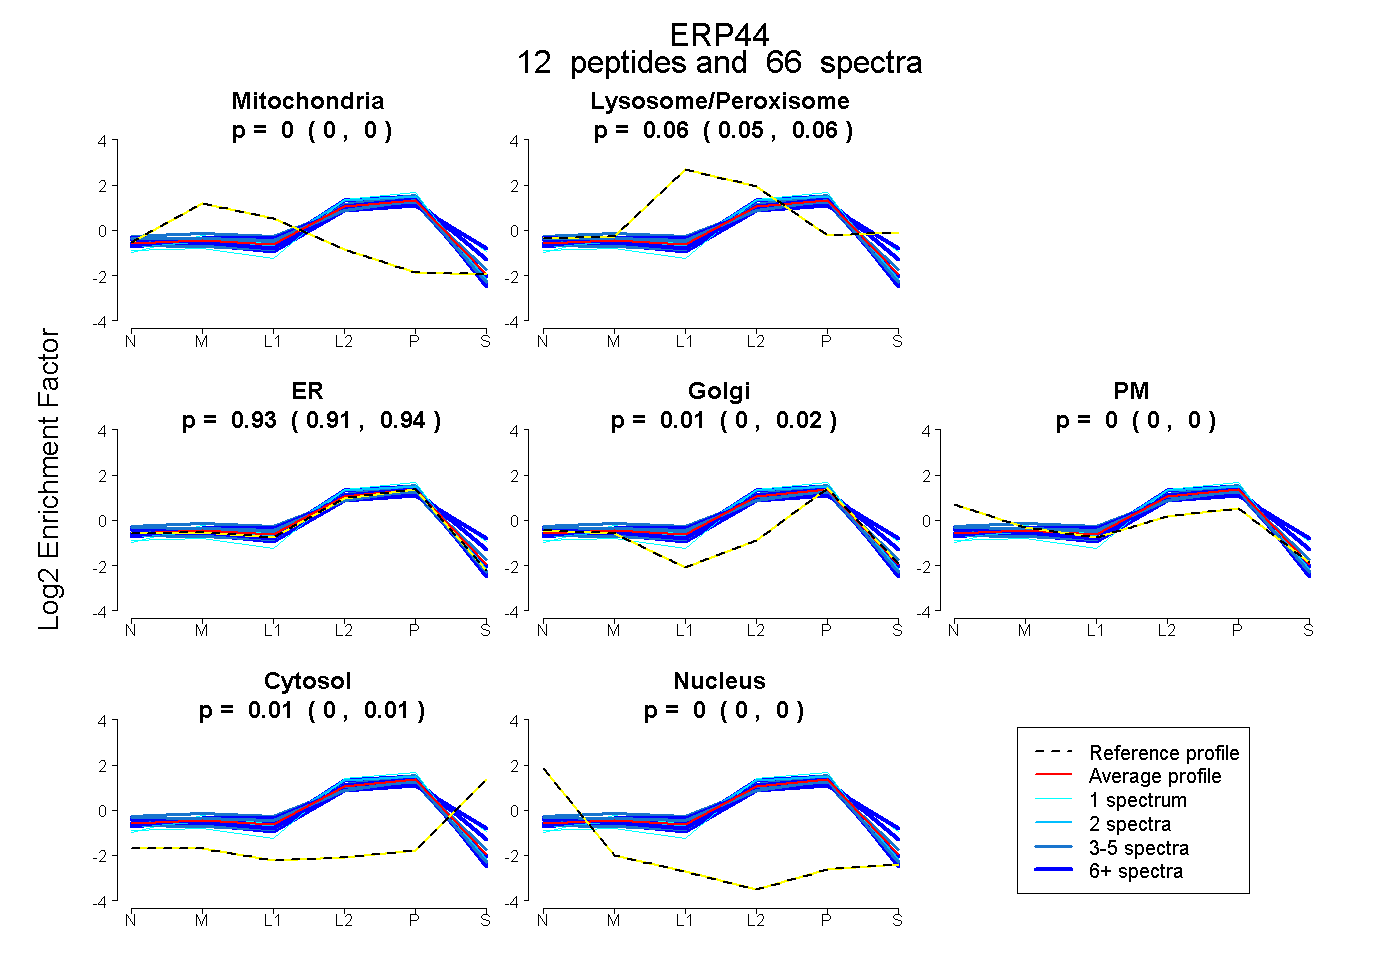
0.000 | 0.000
0.052 | 0.065
0.912 | 0.941
0.000 | 0.017
0.000 | 0.000
0.000 | 0.009
0.000 | 0.000
15peptides
spectra
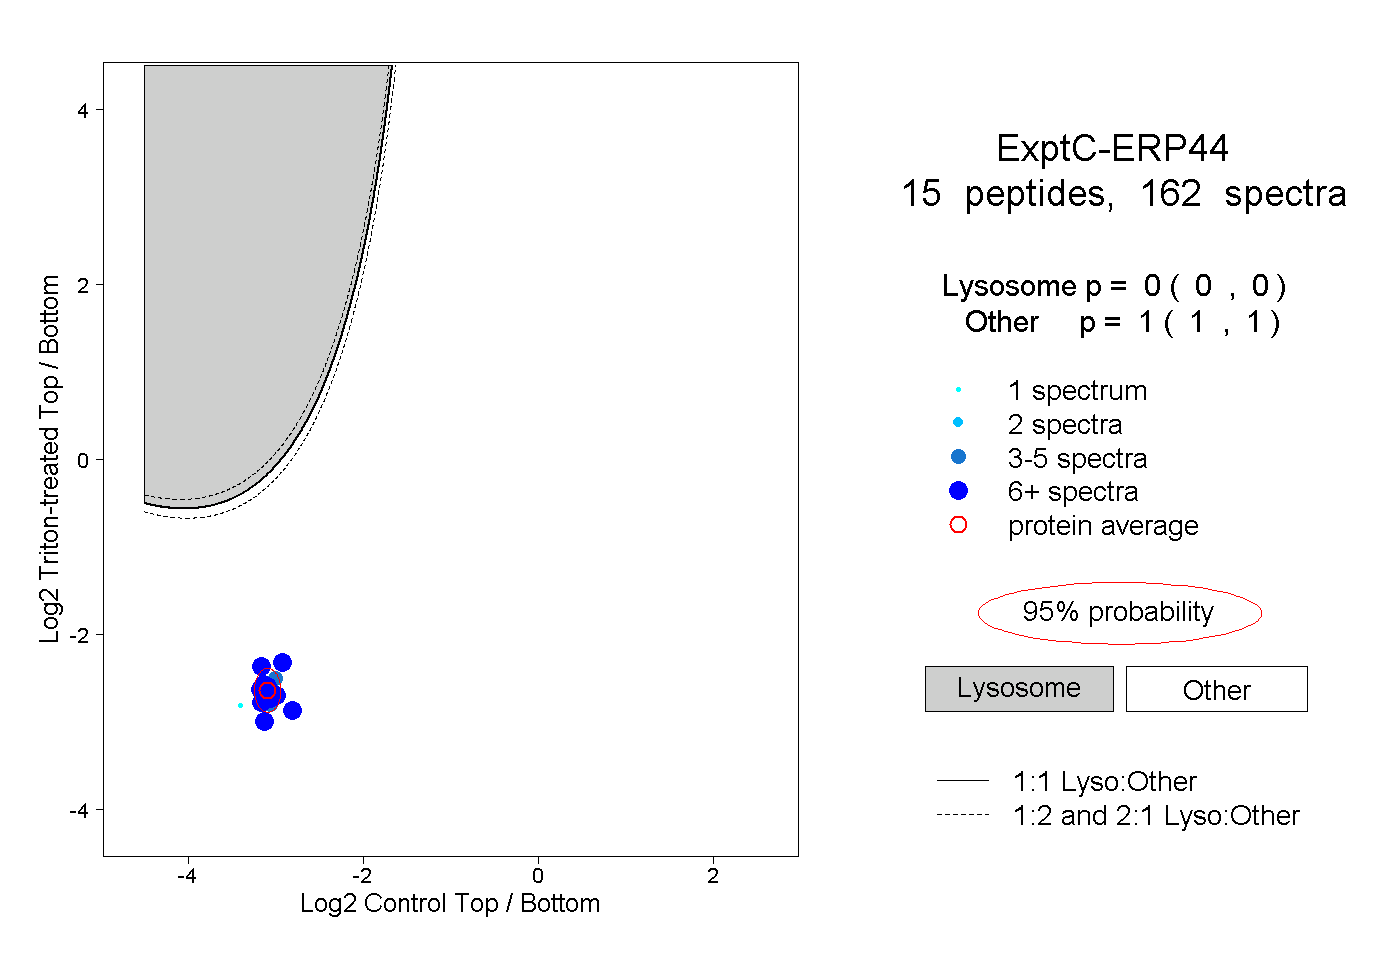
0.000 | 0.000
1.000 | 1.000
9peptides
spectra
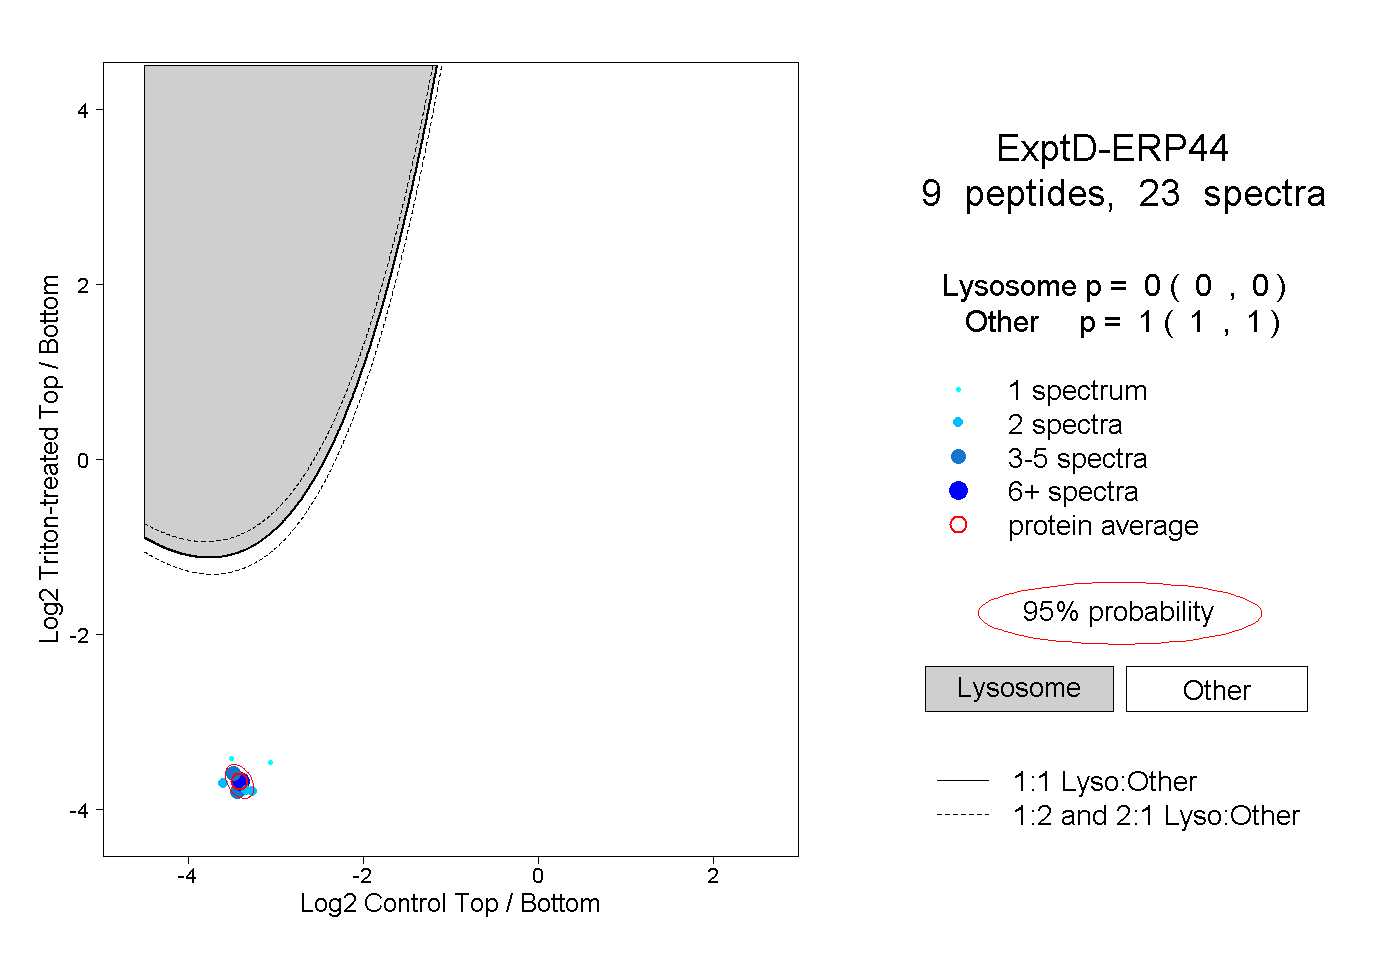
0.000 | 0.000
1.000 | 1.000