 7
7peptides
spectra
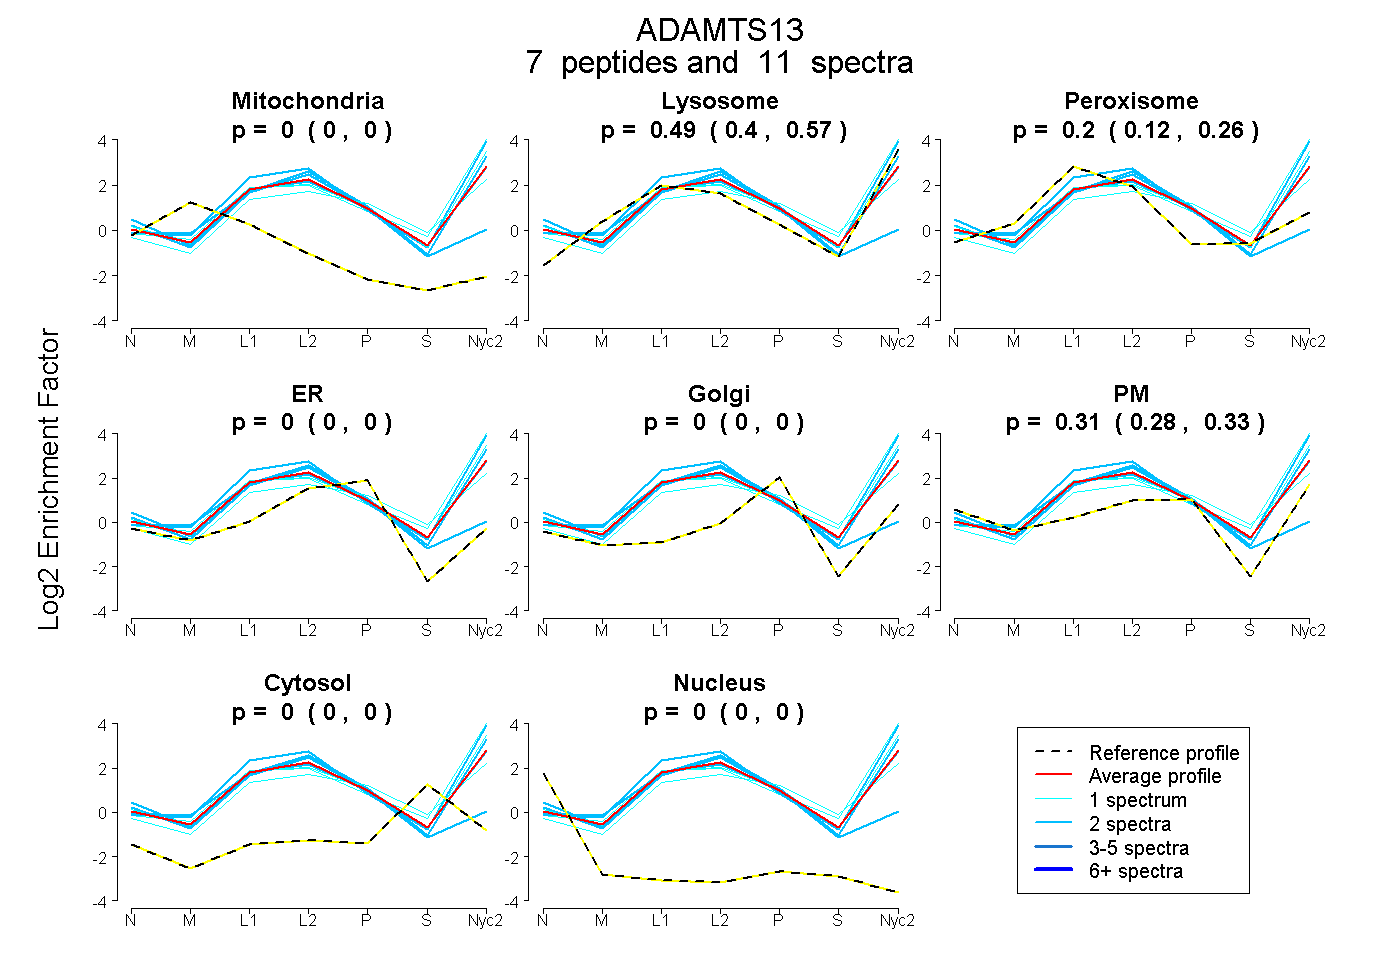
0.000 | 0.000
0.397 | 0.569
0.123 | 0.264
0.000 | 0.000
0.000 | 0.000
0.280 | 0.328
0.000 | 0.000
0.000 | 0.000
2peptides
spectra
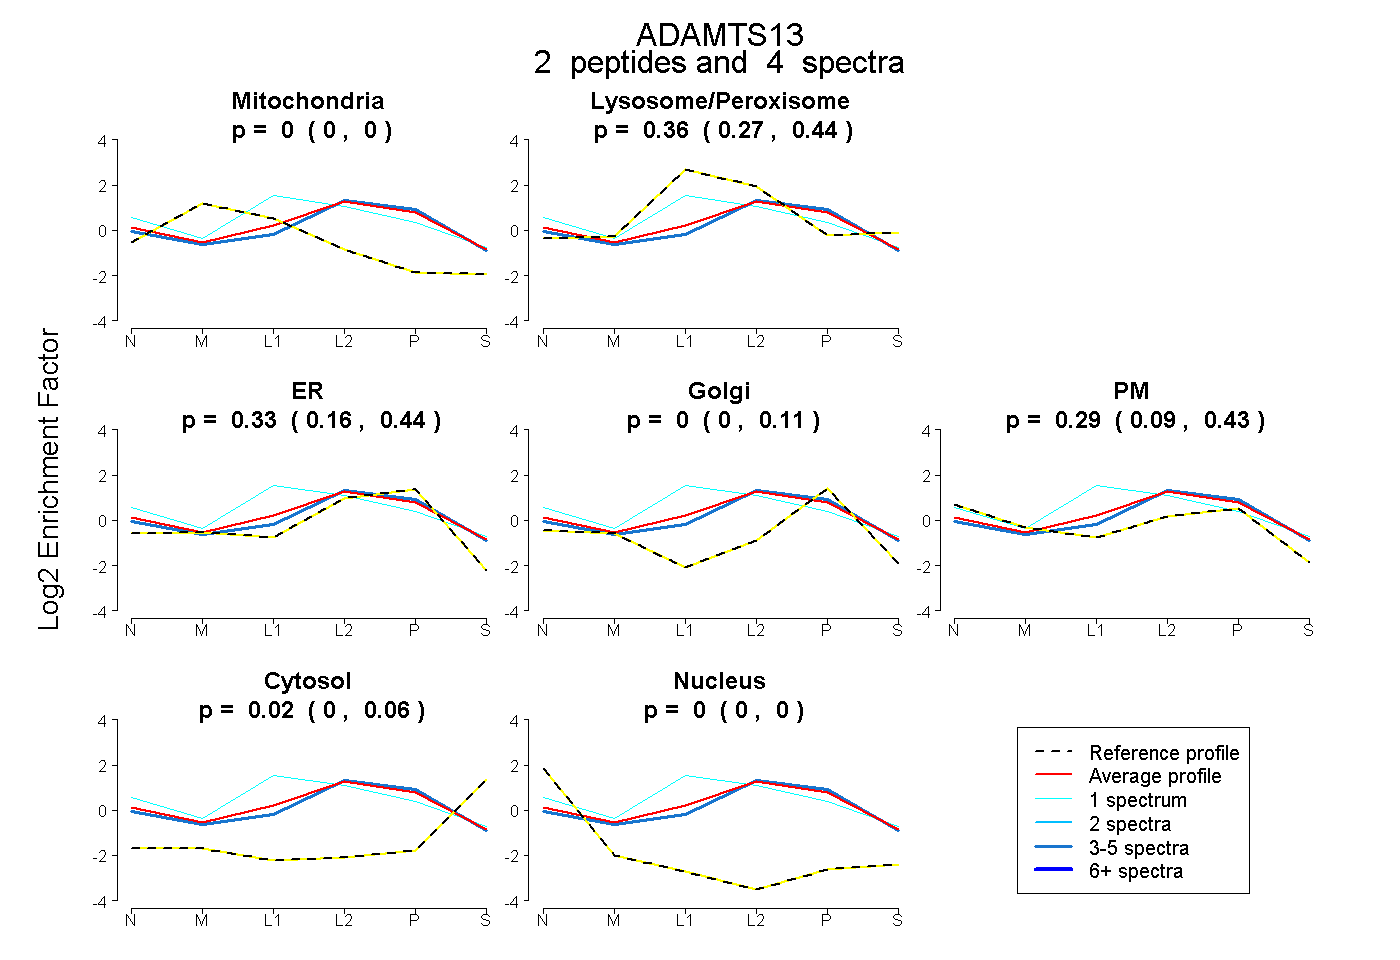
0.000 | 0.000
0.273 | 0.444
0.164 | 0.439
0.000 | 0.107
0.085 | 0.427
0.000 | 0.062
0.000 | 0.000
10peptides
spectra
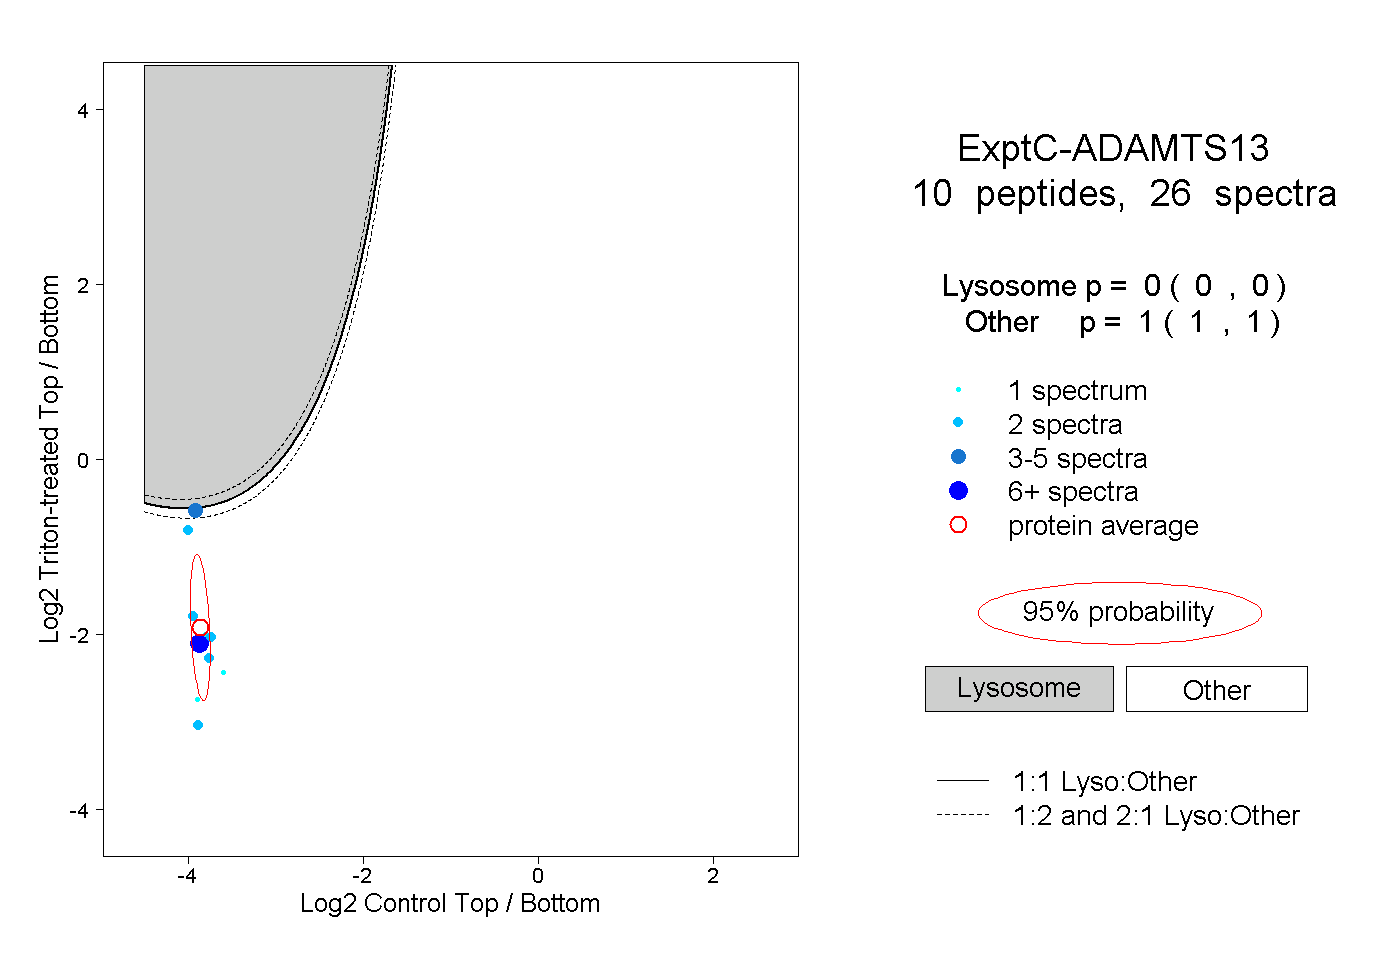
0.000 | 0.000
1.000 | 1.000
2peptides
spectra
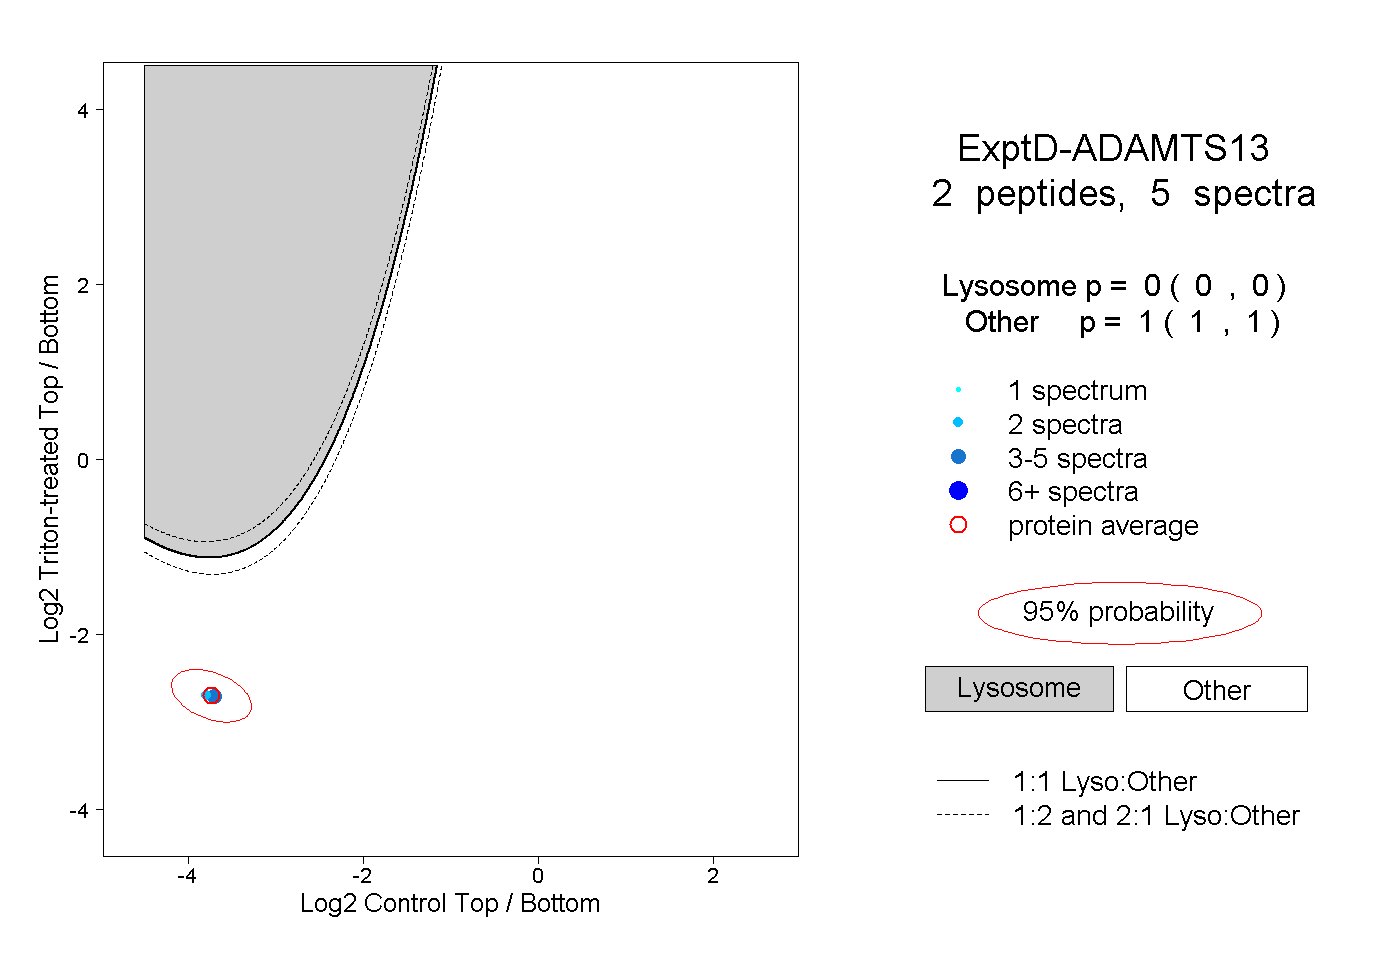
0.000 | 0.000
1.000 | 1.000