 2
2peptides
spectra
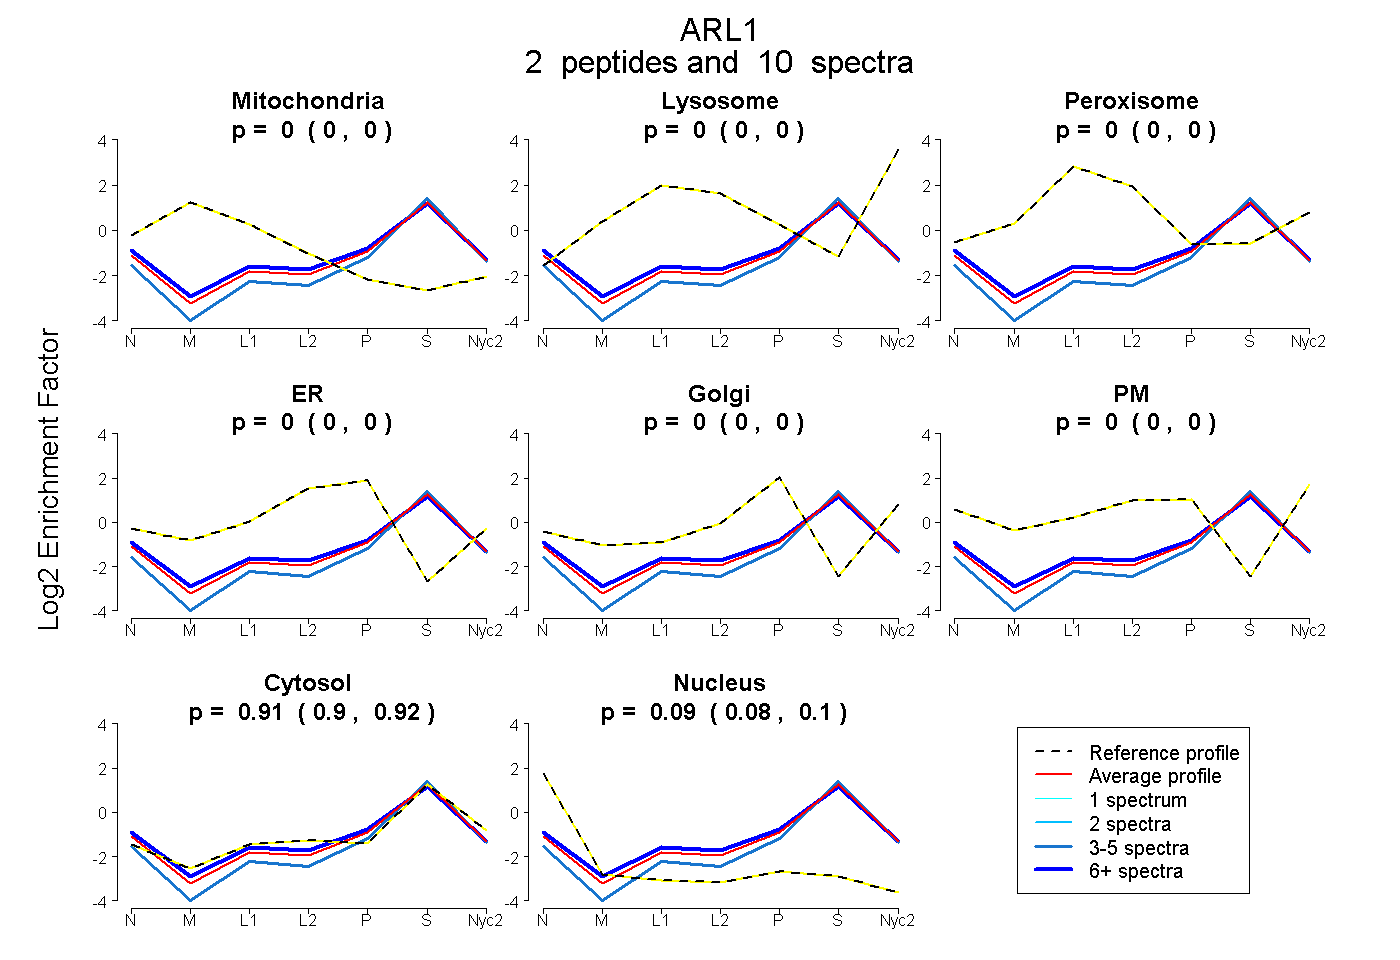
0.000 | 0.000
0.000 | 0.000
0.000 | 0.000
0.000 | 0.000
0.000 | 0.000
0.000 | 0.000
0.899 | 0.920
0.078 | 0.099
2peptides
spectra
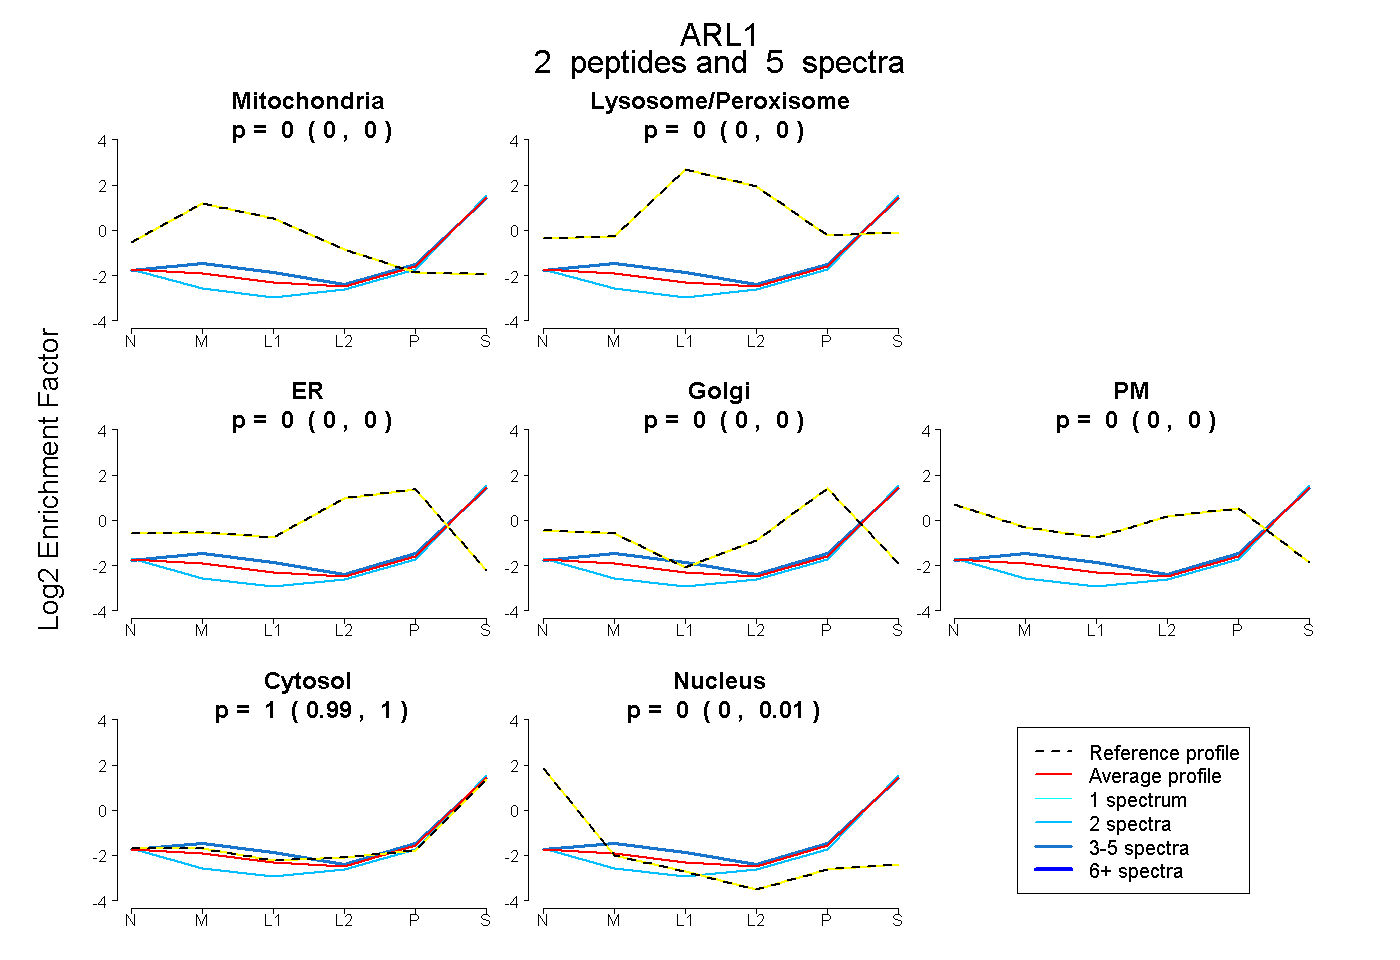
0.000 | 0.000
0.000 | 0.000
0.000 | 0.000
0.000 | 0.000
0.000 | 0.000
0.990 | 1.000
0.000 | 0.009
3peptides
spectra
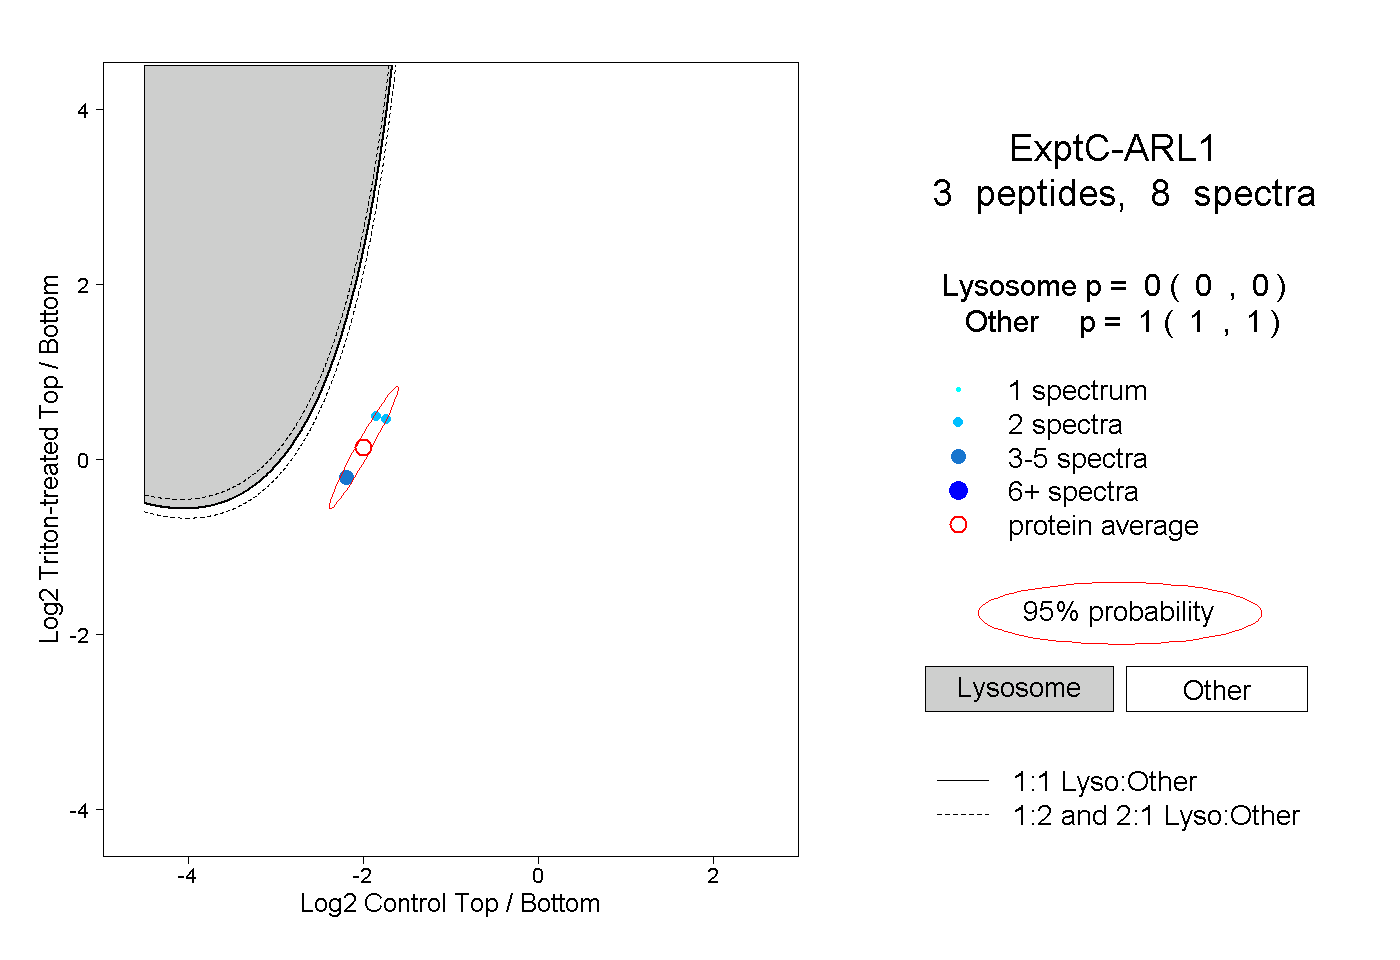
0.000 | 0.000
1.000 | 1.000