 3
3peptides
spectra
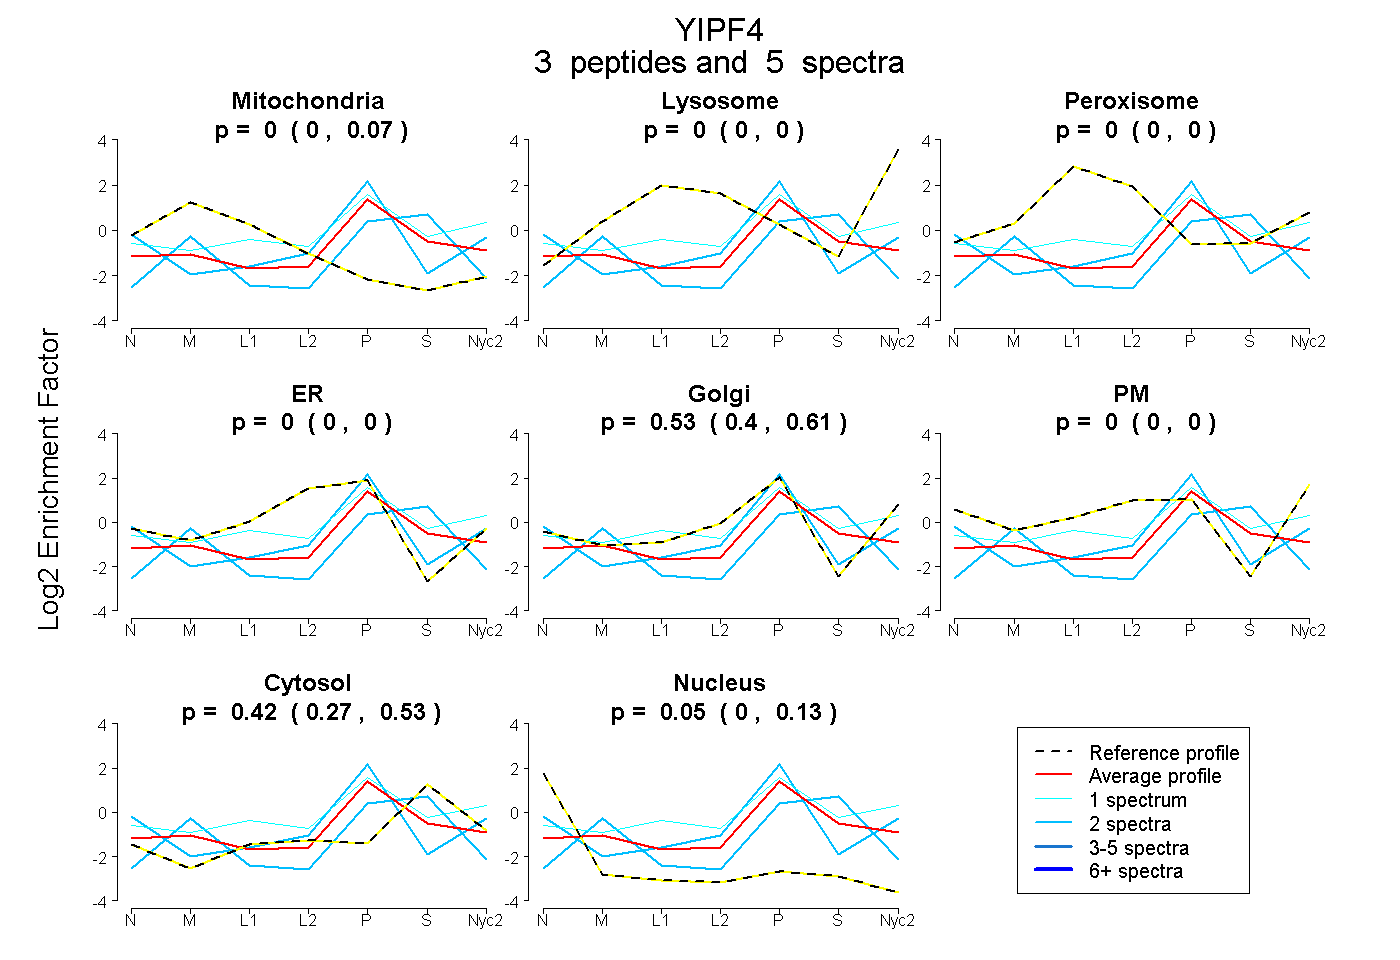
0.000 | 0.073
0.000 | 0.000
0.000 | 0.000
0.000 | 0.000
0.401 | 0.612
0.000 | 0.000
0.268 | 0.526
0.000 | 0.131
2peptides
spectra
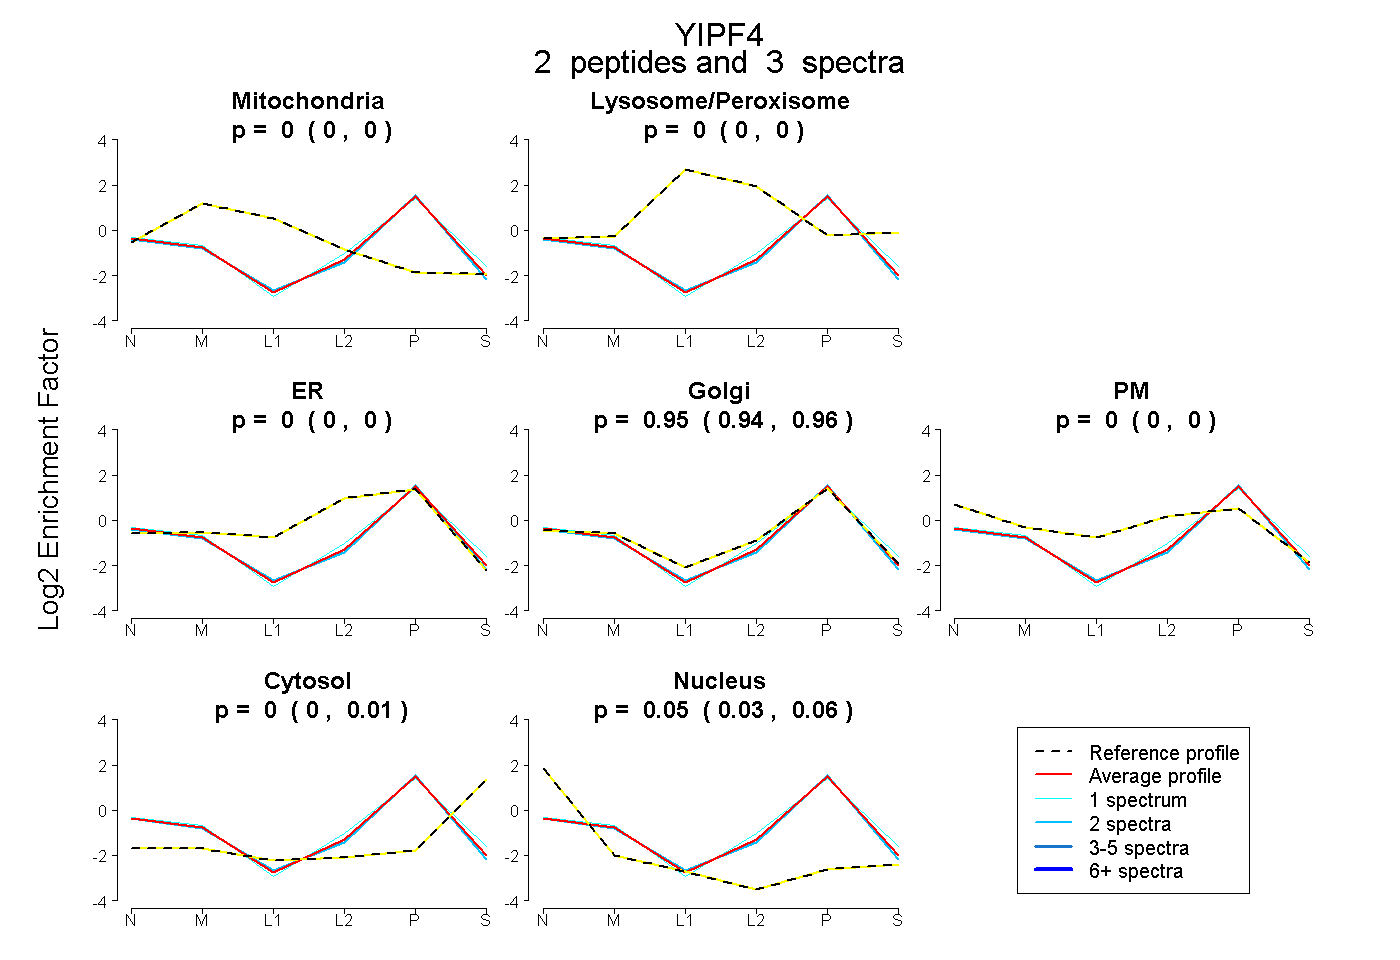
0.000 | 0.000
0.000 | 0.000
0.000 | 0.000
0.935 | 0.965
0.000 | 0.000
0.000 | 0.007
0.029 | 0.062
1peptide
spectra
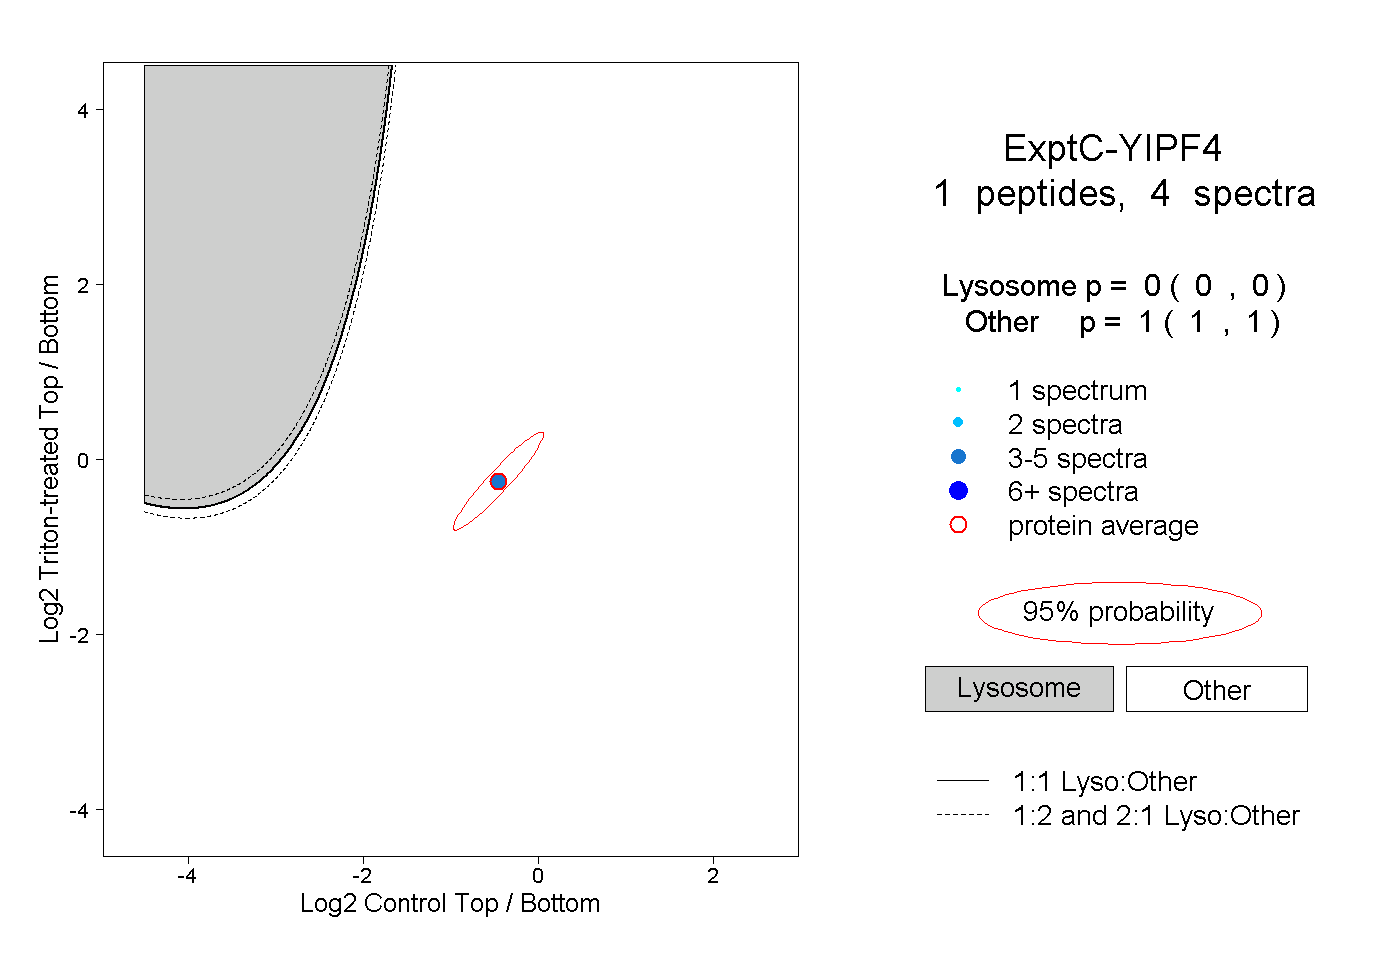
0.000 | 0.000
1.000 | 1.000