 5
5peptides
spectra
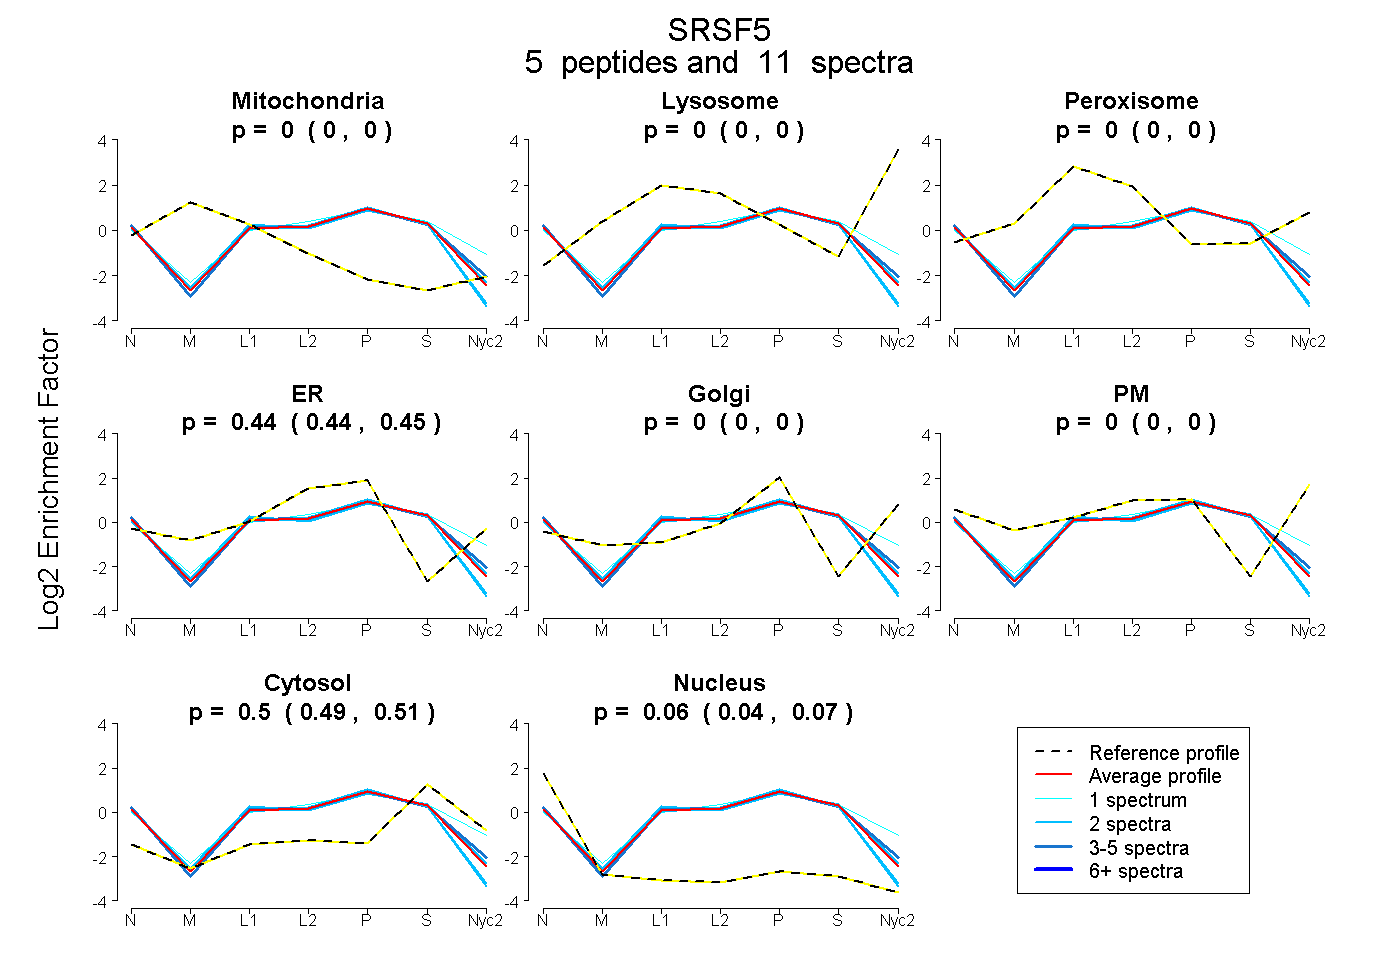
0.000 | 0.000
0.000 | 0.000
0.000 | 0.000
0.437 | 0.450
0.000 | 0.000
0.000 | 0.000
0.487 | 0.507
0.042 | 0.072
5peptides
spectra
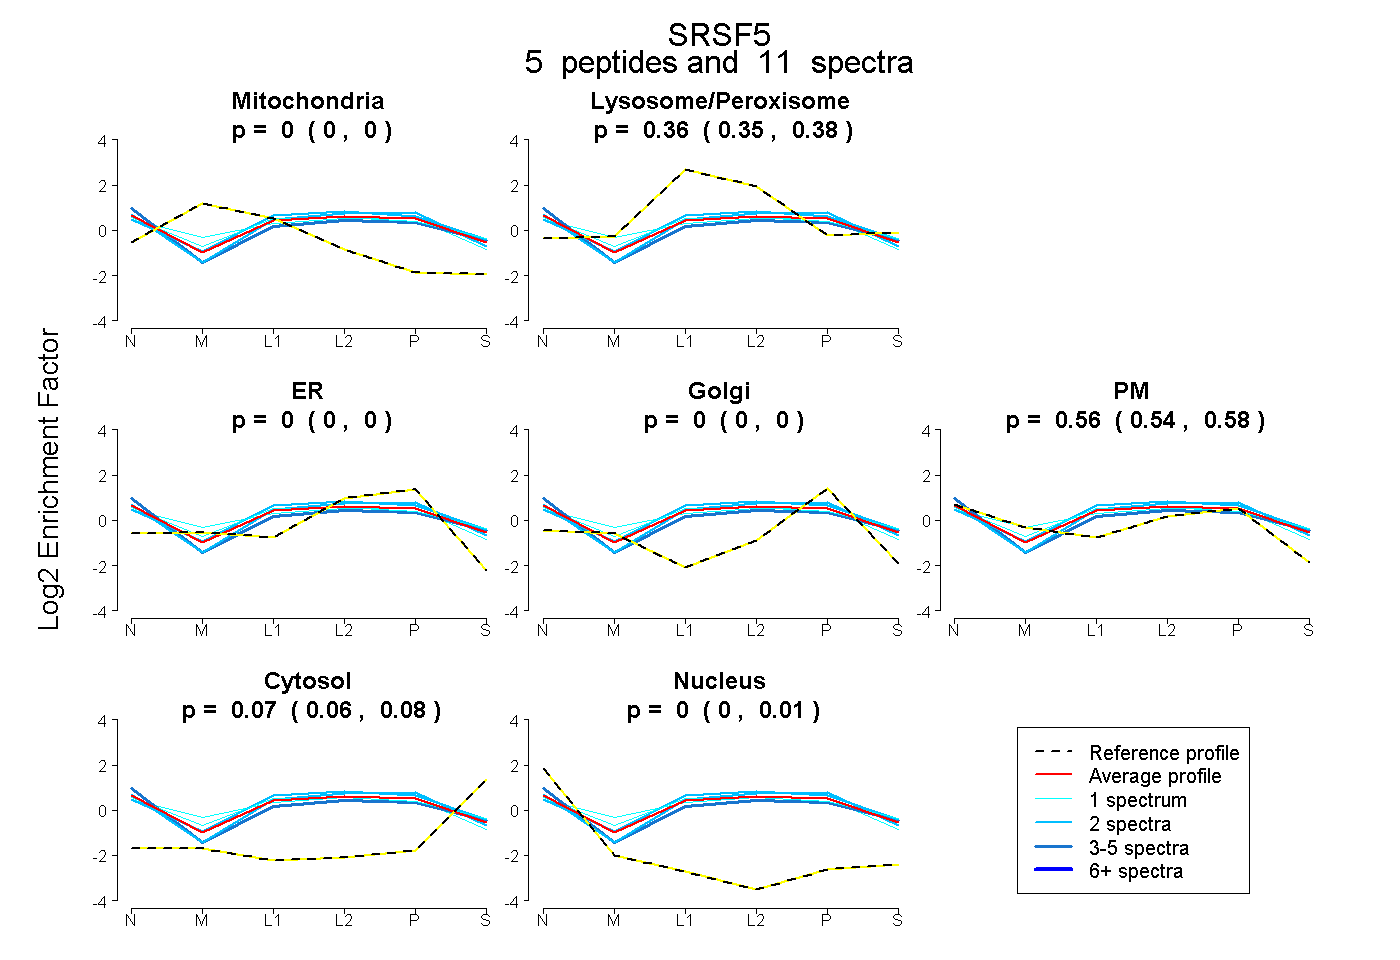
0.000 | 0.000
0.353 | 0.375
0.000 | 0.000
0.000 | 0.003
0.541 | 0.575
0.062 | 0.082
0.000 | 0.007
8peptides
spectra
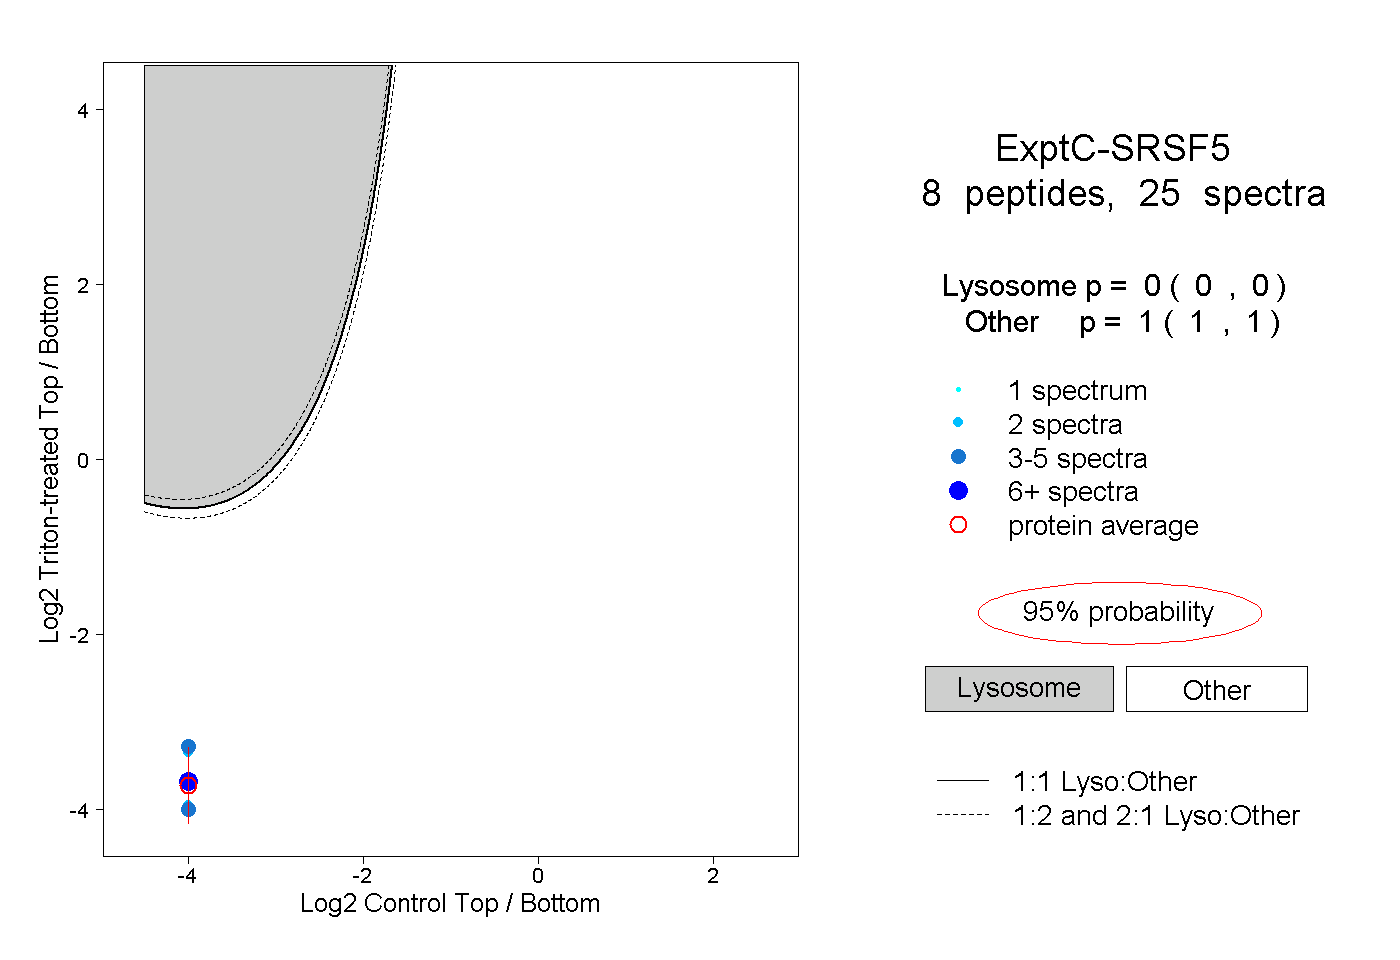
0.000 | 0.000
1.000 | 1.000
3peptides
spectra
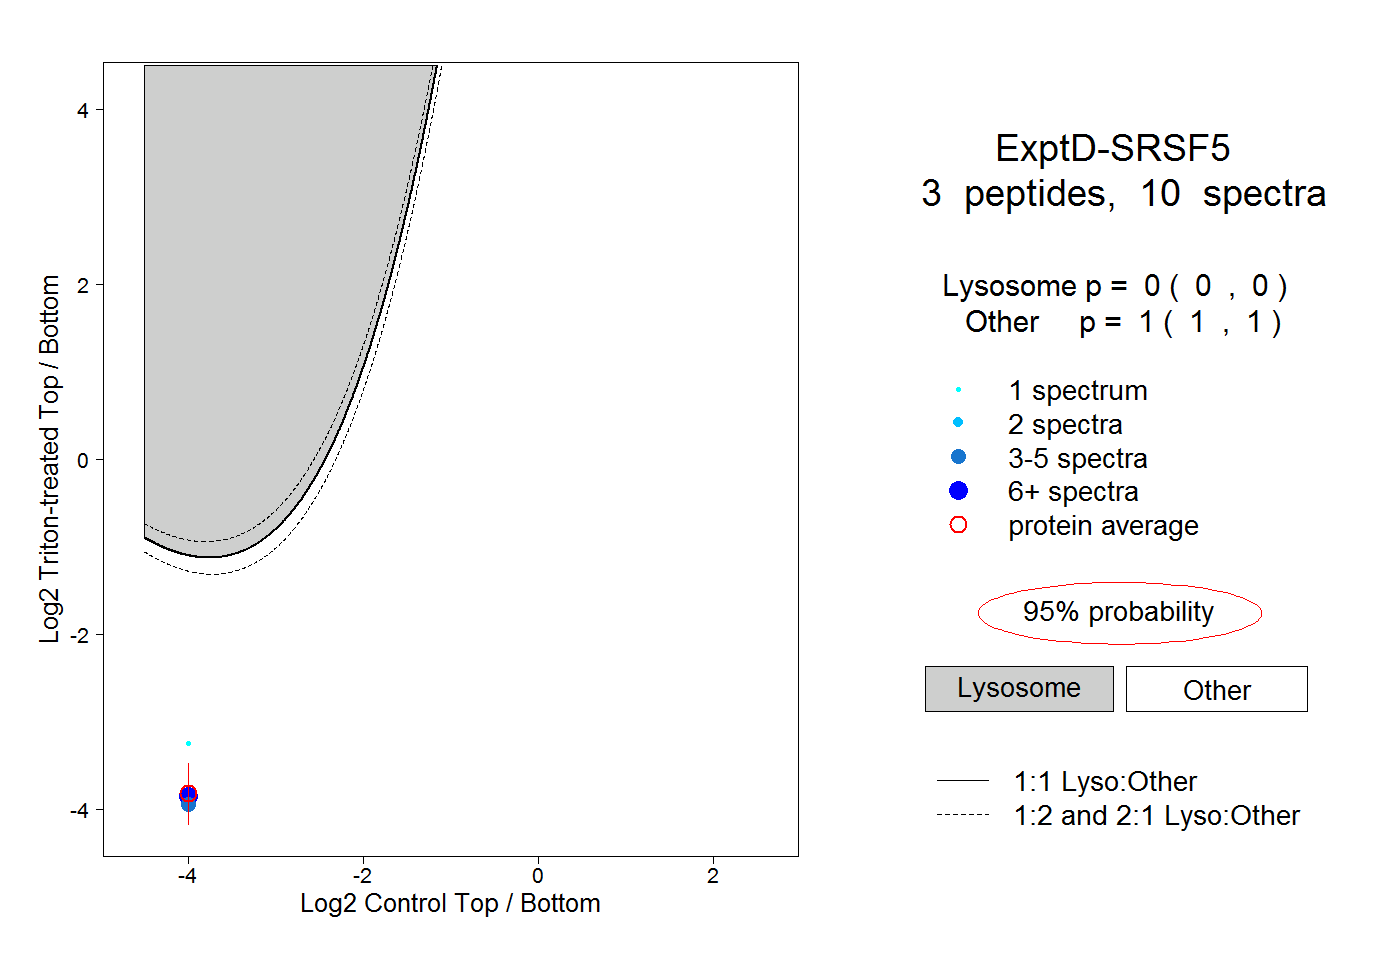
0.000 | 0.000
1.000 | 1.000