 7
7peptides
spectra
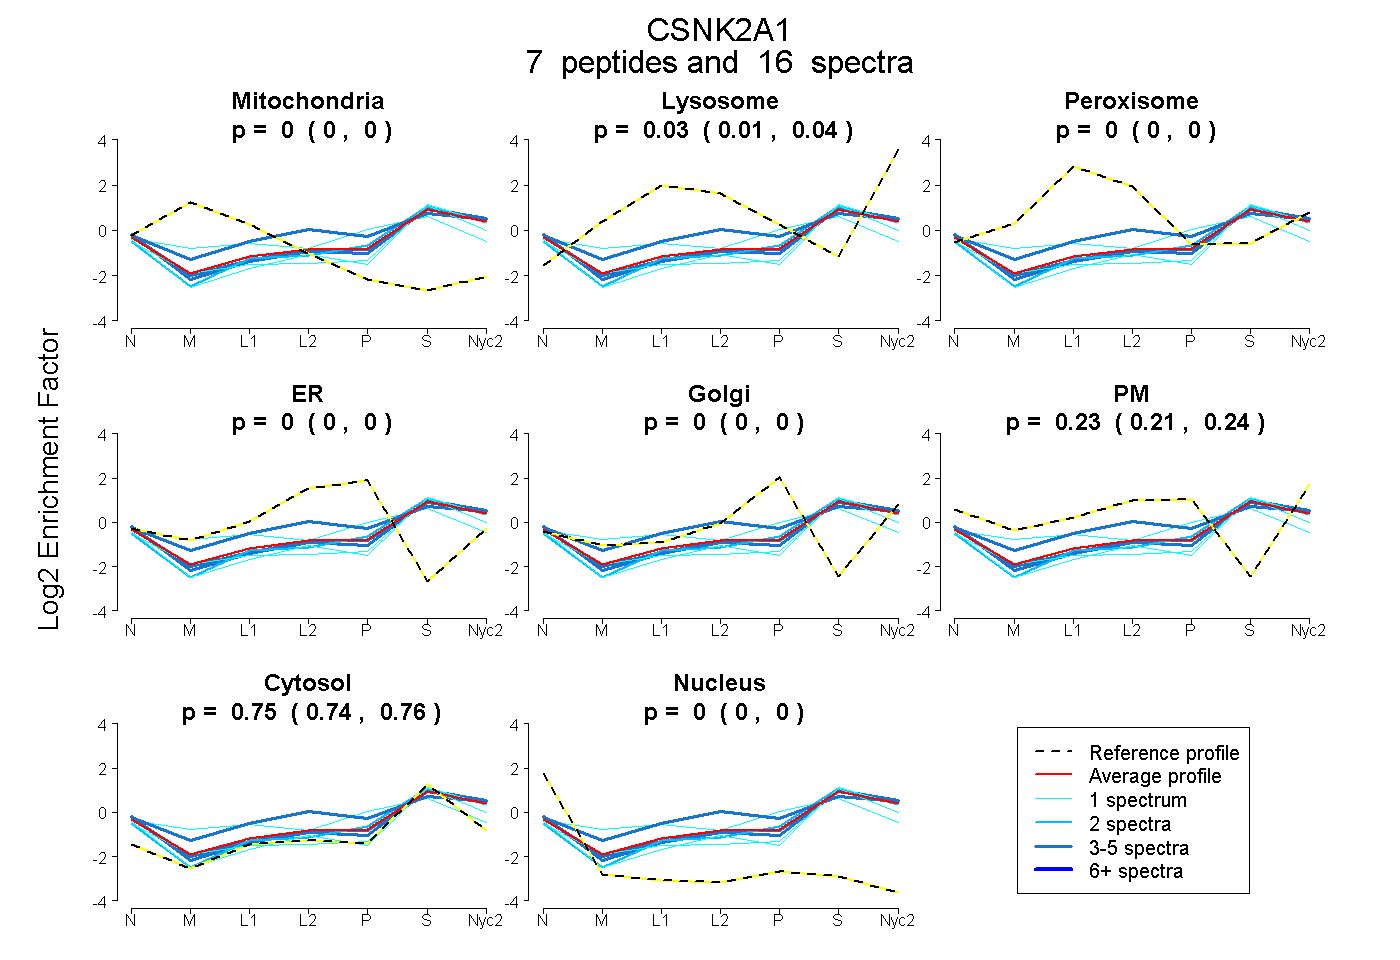
0.000 | 0.000
0.010 | 0.038
0.000 | 0.000
0.000 | 0.000
0.000 | 0.000
0.213 | 0.240
0.736 | 0.755
0.000 | 0.000
4peptides
spectra
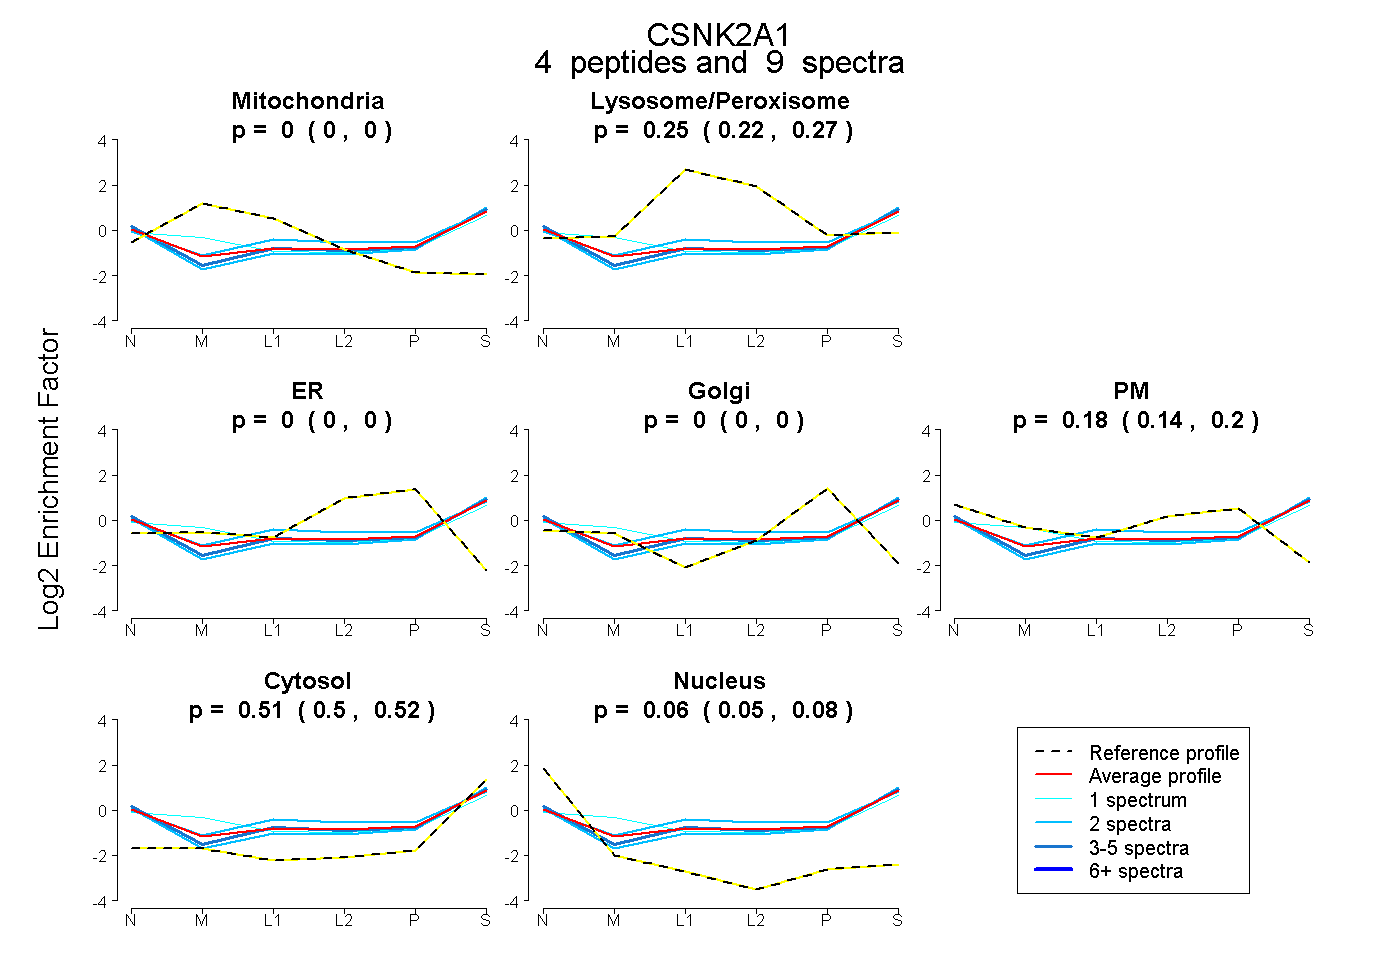
0.000 | 0.000
0.224 | 0.267
0.000 | 0.000
0.000 | 0.000
0.142 | 0.205
0.497 | 0.521
0.046 | 0.082
7peptides
spectra
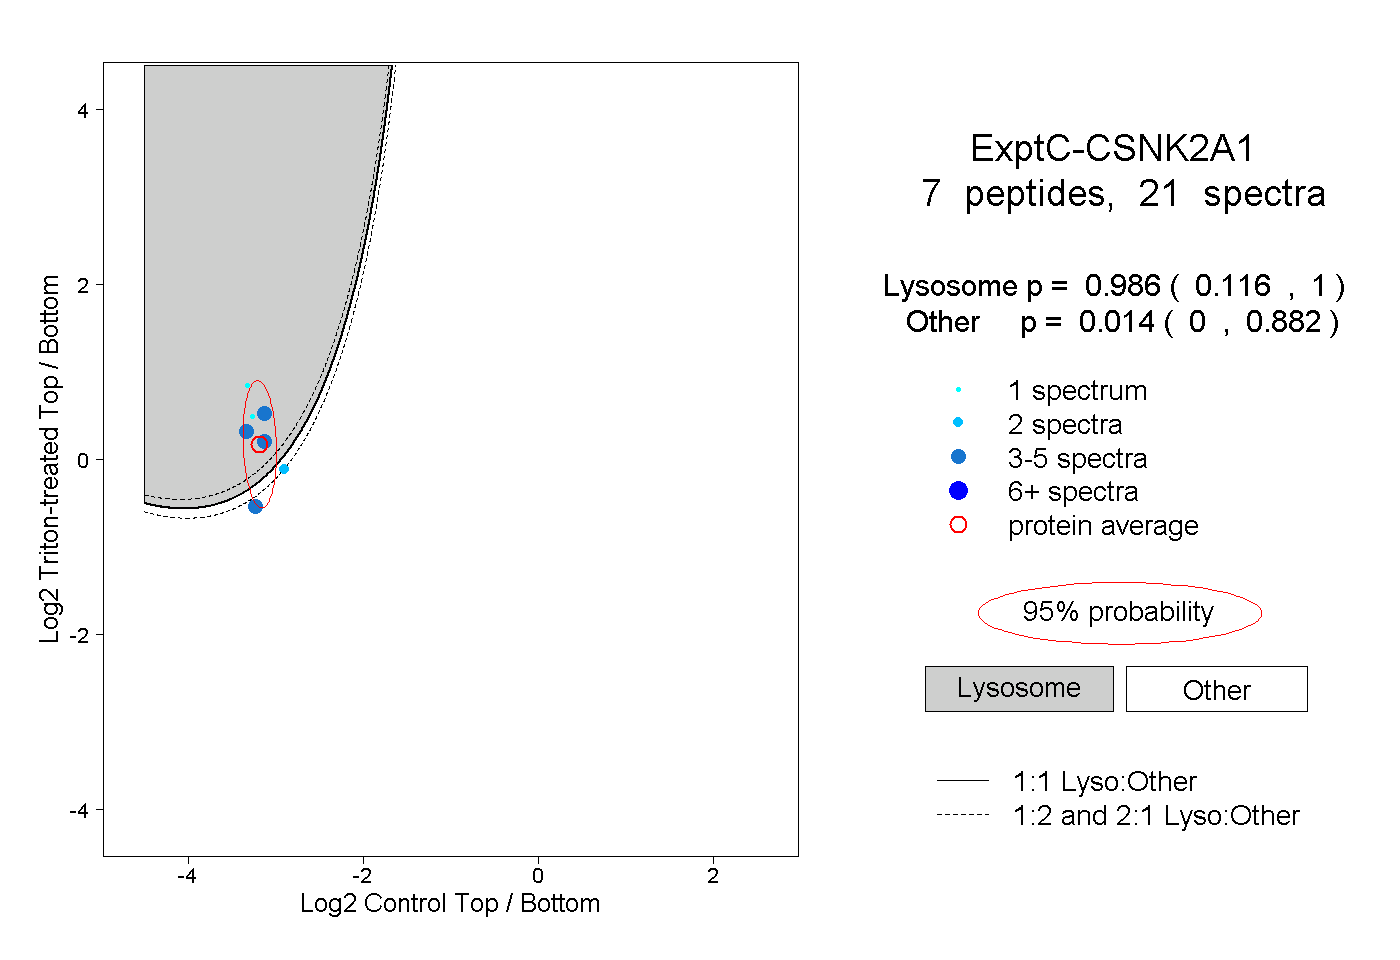
0.116 | 1.000
0.000 | 0.882
1peptide
spectrum
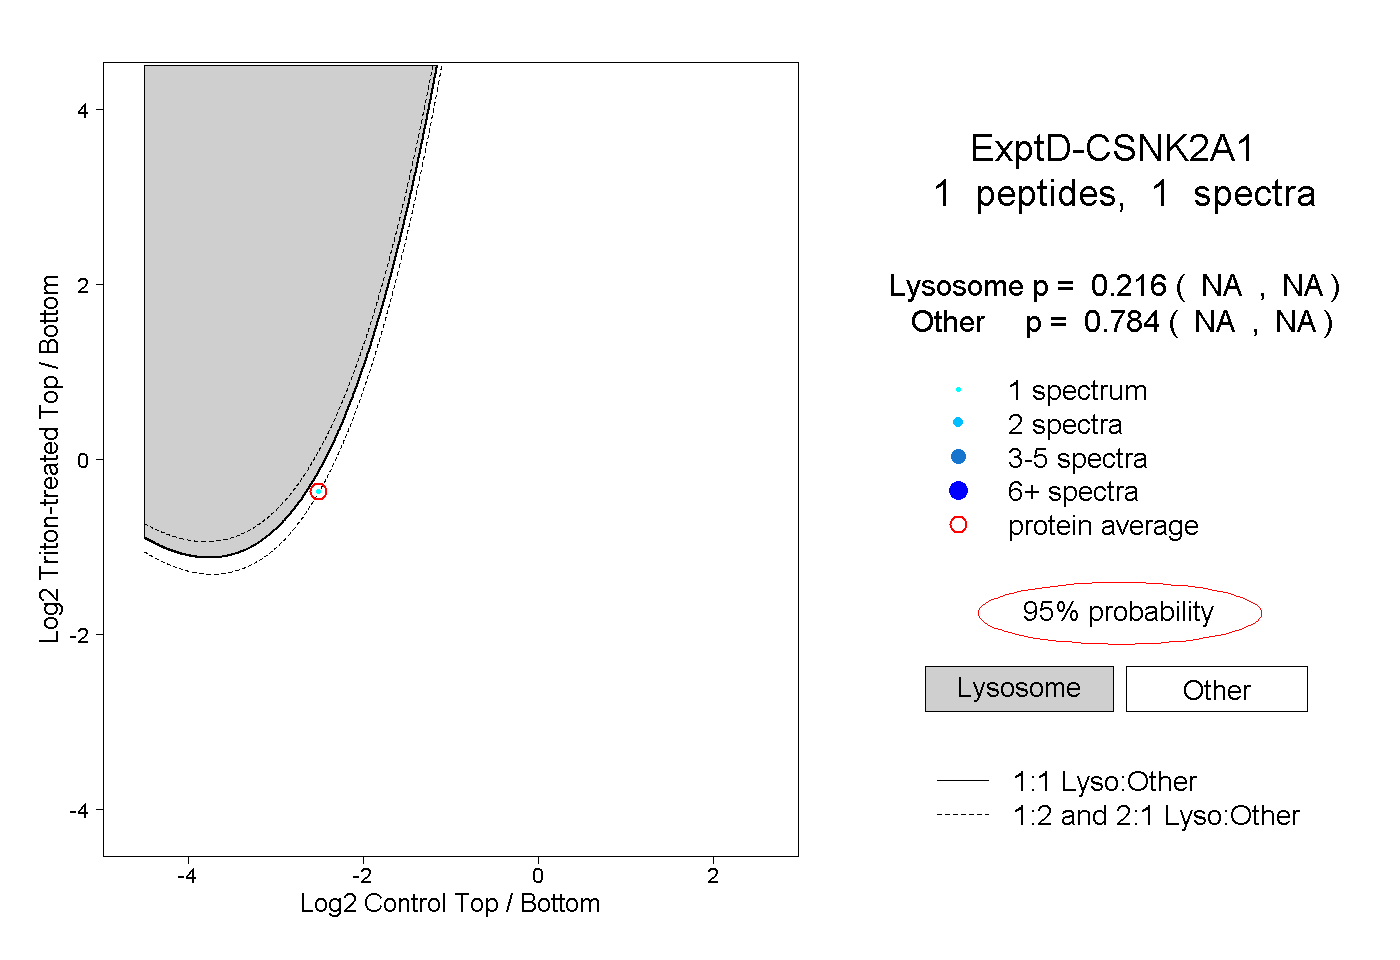
NA | NA
NA | NA