 8
8peptides
spectra
0.093 | 0.117
0.000 | 0.000
0.204 | 0.255
0.415 | 0.493
0.099 | 0.178
0.017 | 0.095
0.000 | 0.000
0.000 | 0.000
| Plot | Mito | Lyso | Perox | ER | Golgi | PM | Cytosol | Nucleus | |||||
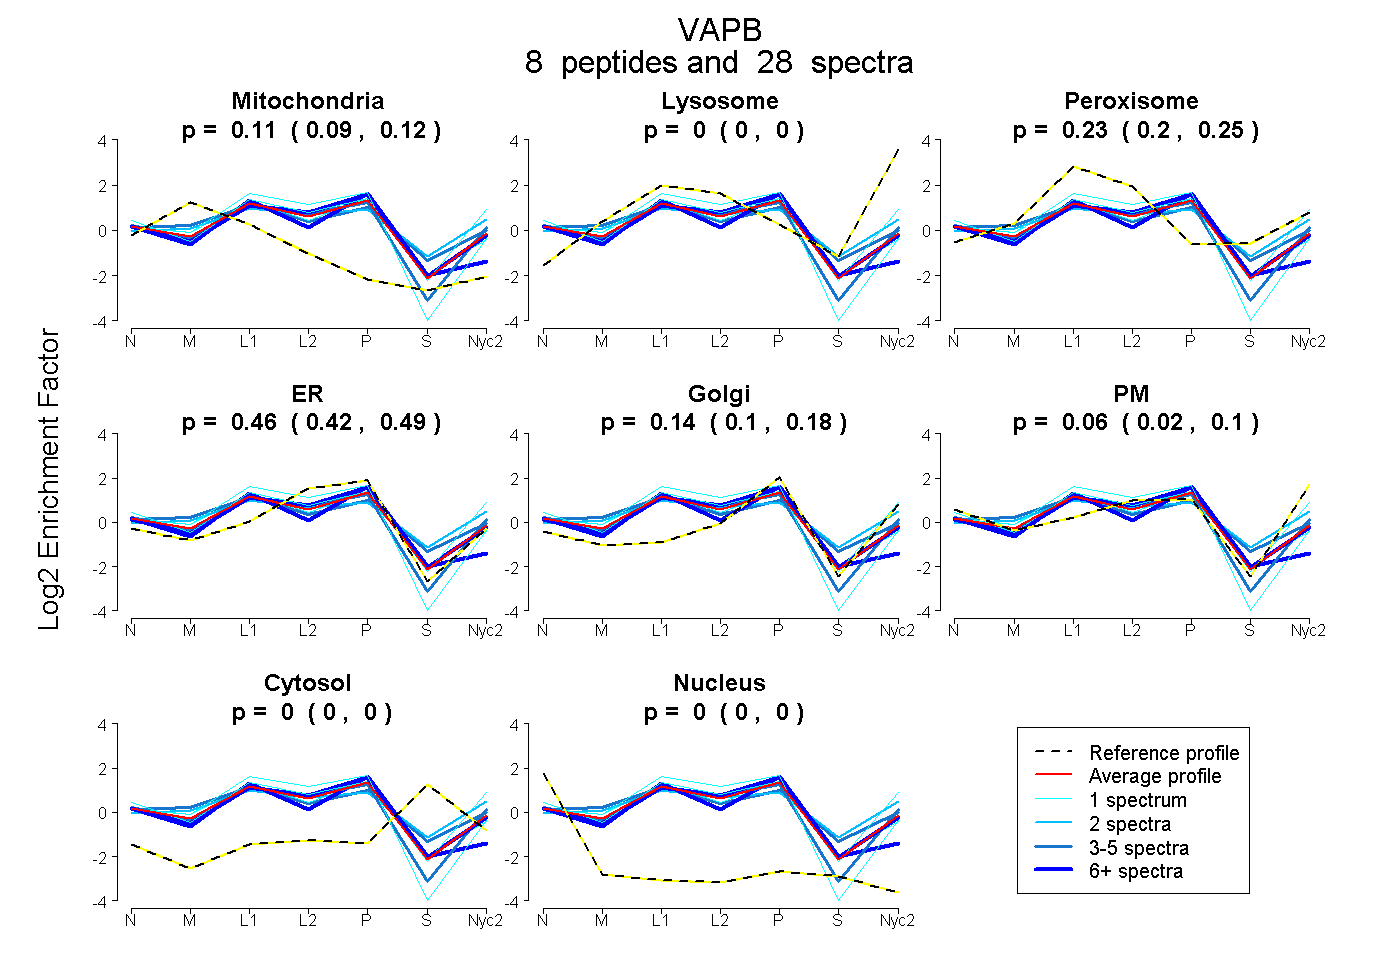
| Expt A |
8 peptides |
28 spectra |
|
0.106 0.093 | 0.117 |
0.000 0.000 | 0.000 |
0.233 0.204 | 0.255 |
0.458 0.415 | 0.493 |
0.145 0.099 | 0.178 |
0.059 0.017 | 0.095 |
0.000 0.000 | 0.000 |
0.000 0.000 | 0.000 |
| 7 spectra, LQGEVQR | 0.026 | 0.000 | 0.252 | 0.561 | 0.141 | 0.000 | 0.000 | 0.021 | ||
| 5 spectra, LGNPTDR | 0.159 | 0.000 | 0.069 | 0.443 | 0.000 | 0.329 | 0.000 | 0.000 | ||
| 1 spectrum, EAKPEDLMDSK | 0.137 | 0.000 | 0.254 | 0.455 | 0.155 | 0.000 | 0.000 | 0.000 | ||
| 5 spectra, ALPSNSPMAALAASGK | 0.000 | 0.000 | 0.456 | 0.134 | 0.331 | 0.000 | 0.000 | 0.079 | ||
| 1 spectrum, VMEECR | 0.000 | 0.000 | 0.218 | 0.217 | 0.060 | 0.505 | 0.000 | 0.000 | ||
| 2 spectra, FMVQSMFAPPDTSDMEAVWK | 0.050 | 0.000 | 0.482 | 0.000 | 0.468 | 0.000 | 0.000 | 0.000 | ||
| 6 spectra, IMPTSASK | 0.106 | 0.000 | 0.160 | 0.652 | 0.000 | 0.000 | 0.000 | 0.081 | ||
| 1 spectrum, VEQVLSLEPQHELK | 0.108 | 0.000 | 0.062 | 0.780 | 0.000 | 0.050 | 0.000 | 0.000 |
| Plot | Mito | Lyso or Perox | ER | Golgi | PM | Cytosol | Nucleus | ||||||
| Expt B |
3 peptides |
9 spectra |
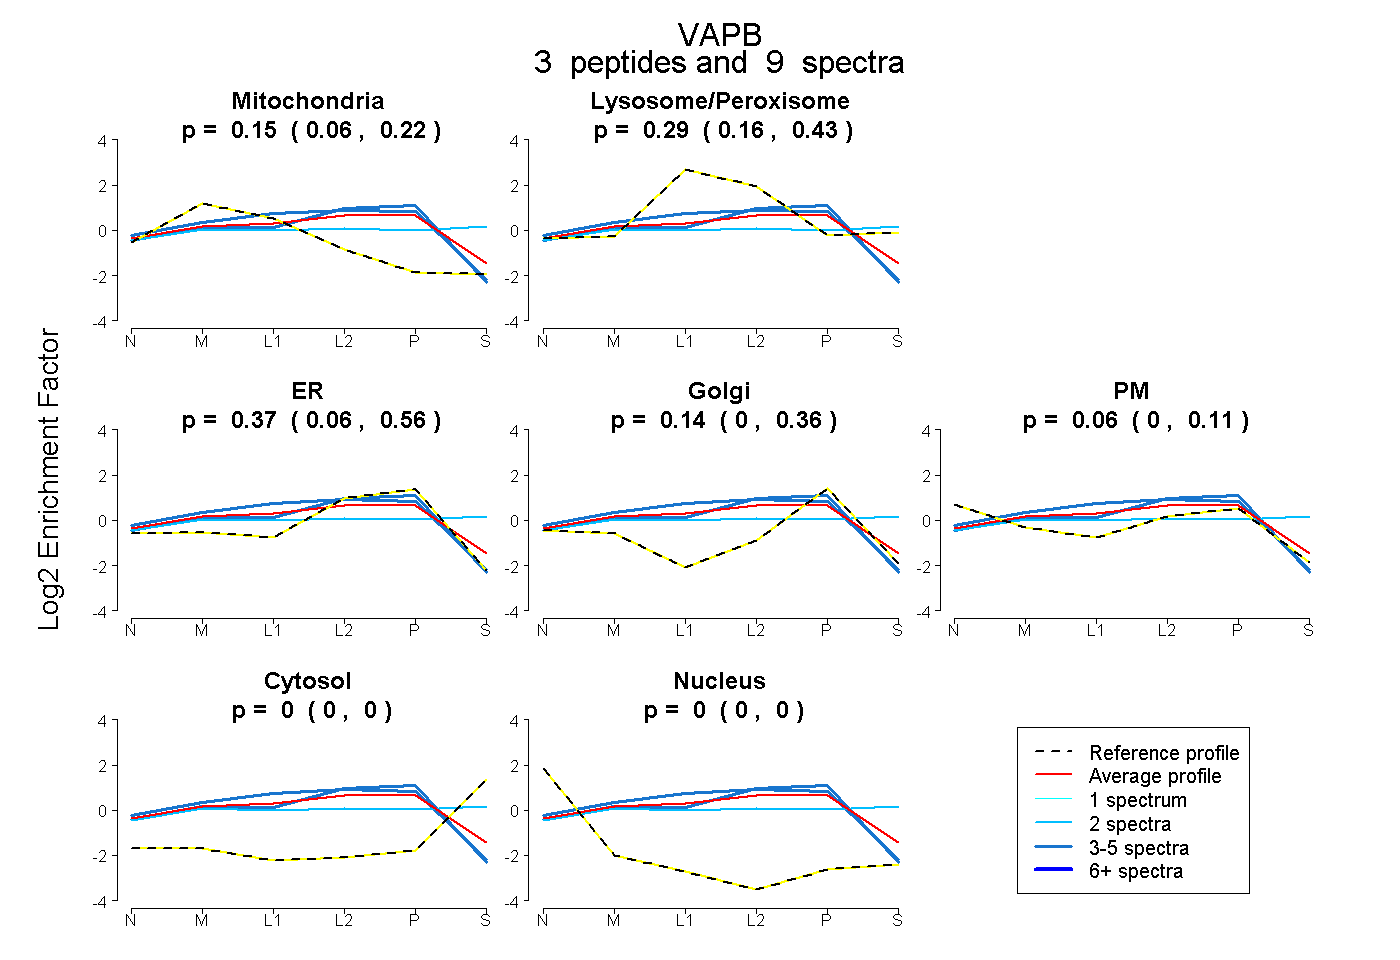 |
0.146 0.057 | 0.217 |
0.288 0.162 | 0.429 |
0.366 0.060 | 0.557 |
0.139 0.000 | 0.360 |
0.061 0.000 | 0.106 |
0.000 0.000 | 0.000 |
0.000 0.000 | 0.000 |
|||
| Plot | Lyso | Other | |||||||||||
| Expt C |
4 peptides |
37 spectra |
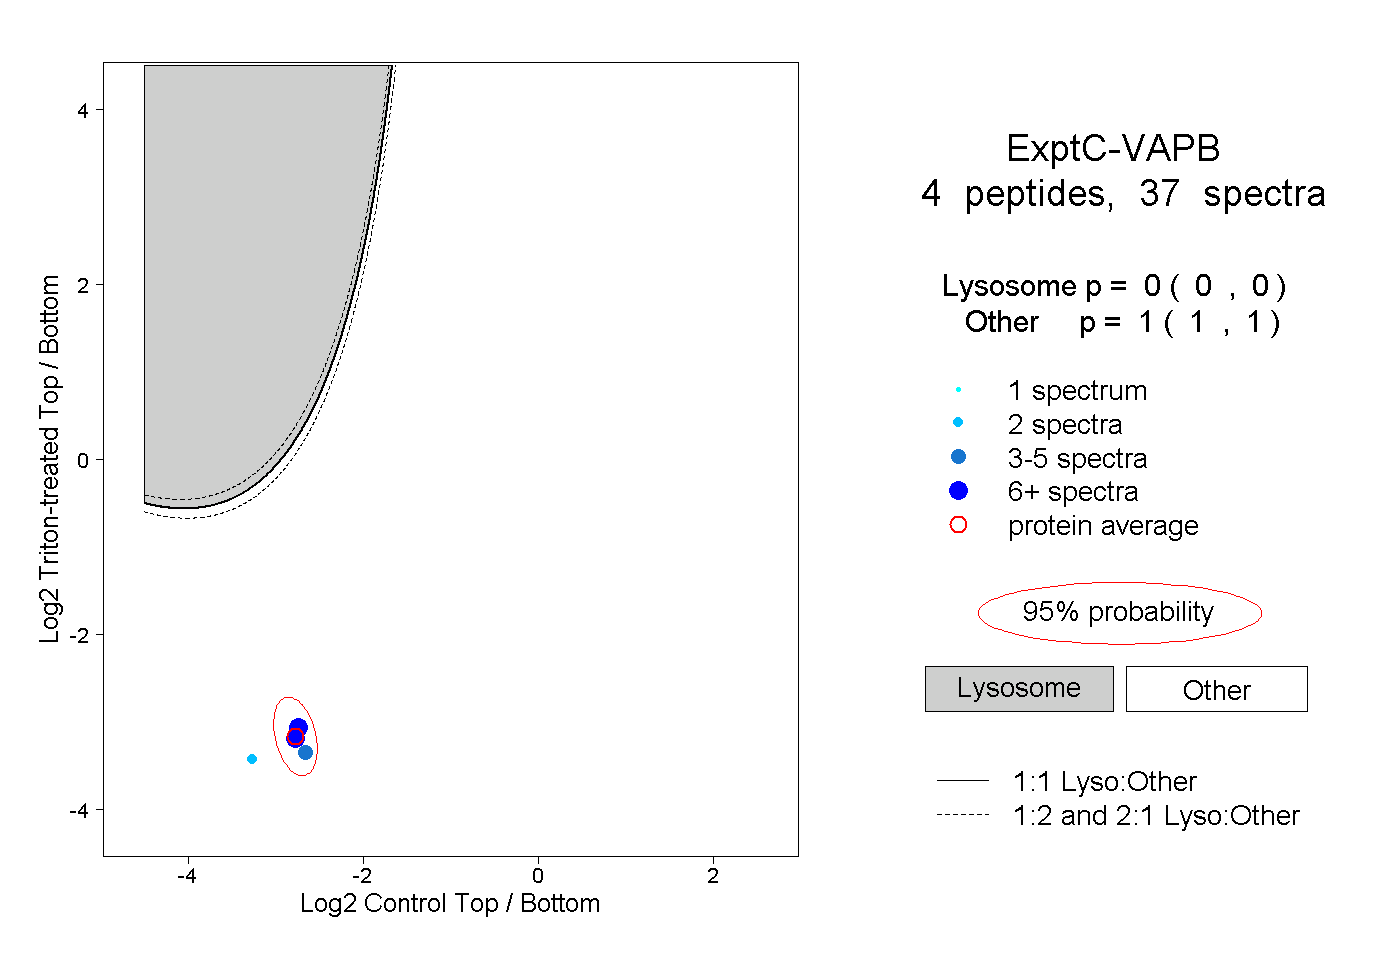 |
0.000 0.000 | 0.000 |
1.000 1.000 | 1.000 |
||||||||
| Plot | Lyso | Other | |||||||||||
| Expt D |
1 peptide |
2 spectra |
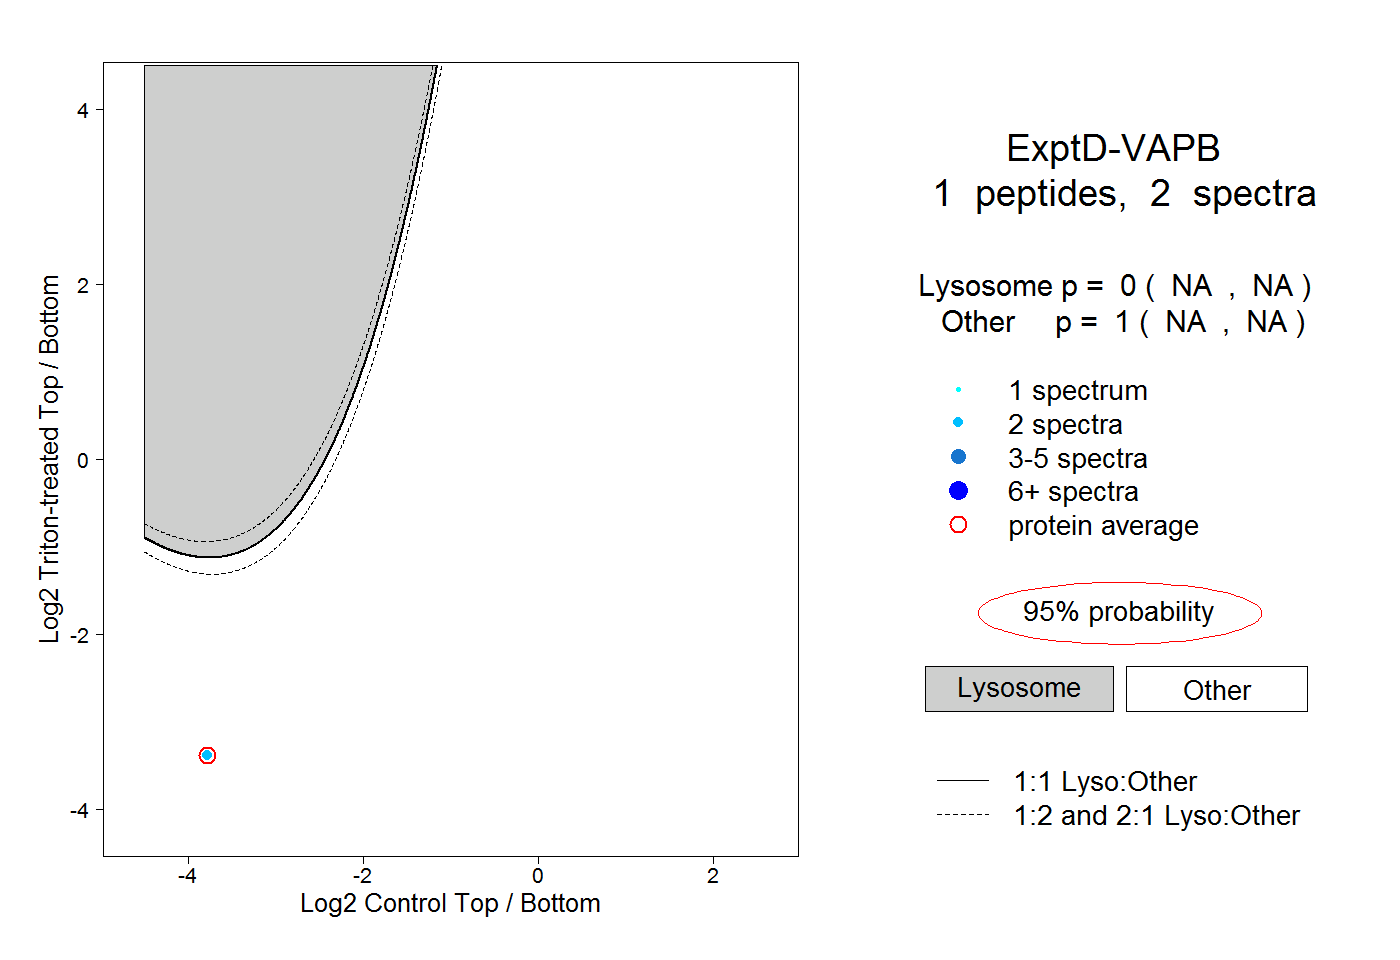 |
0.000 NA | NA |
1.000 NA | NA |