 6
6peptides
spectra
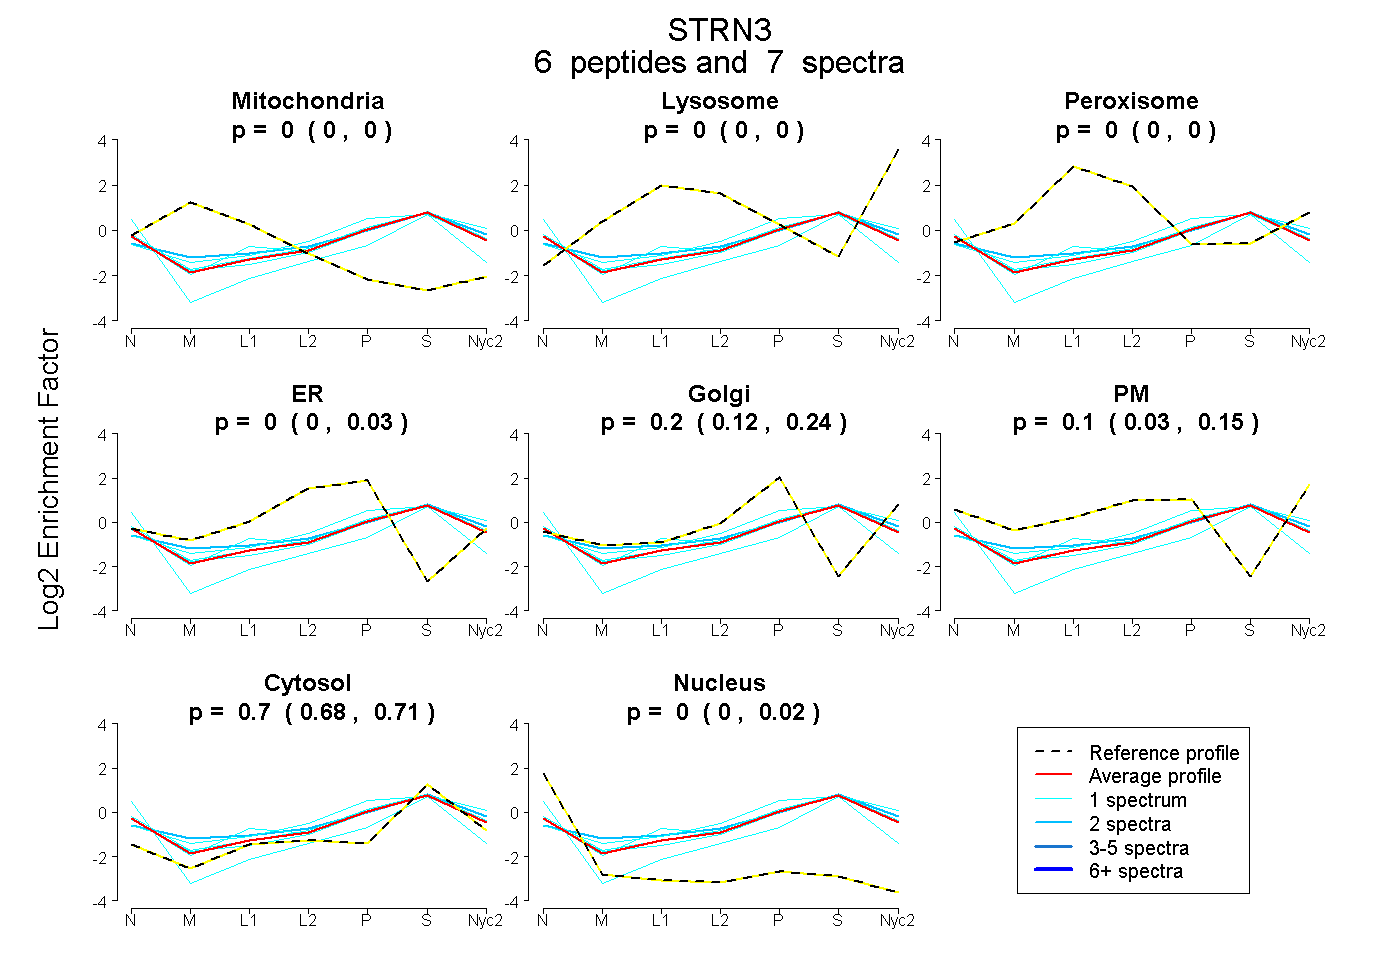
0.000 | 0.000
0.000 | 0.000
0.000 | 0.000
0.000 | 0.033
0.124 | 0.244
0.032 | 0.147
0.684 | 0.714
0.000 | 0.017
5peptides
spectra
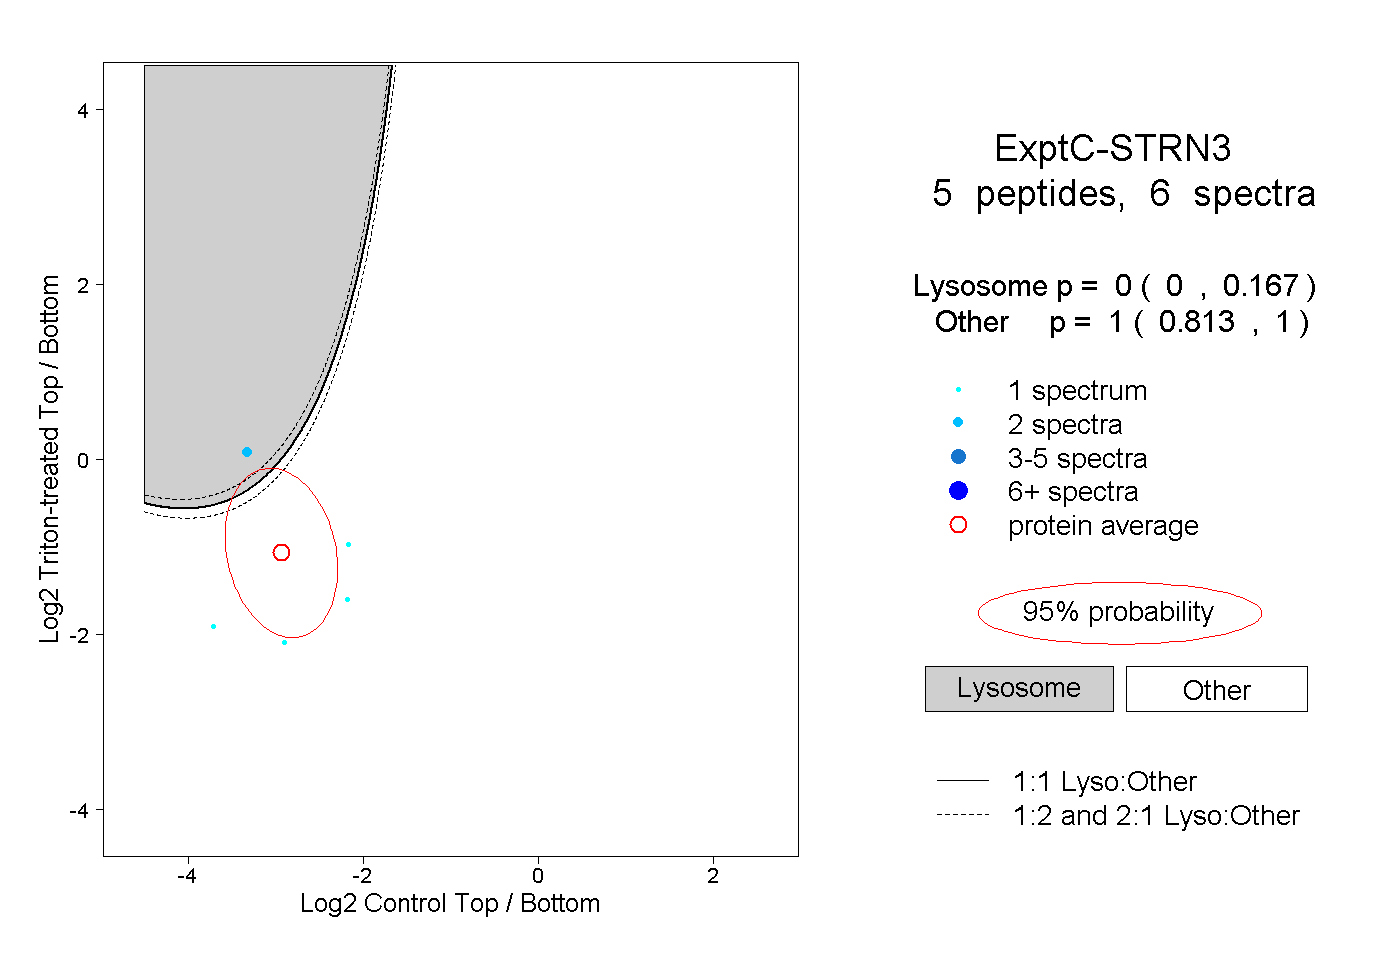
0.000 | 0.167
0.813 | 1.000
1peptide
spectrum
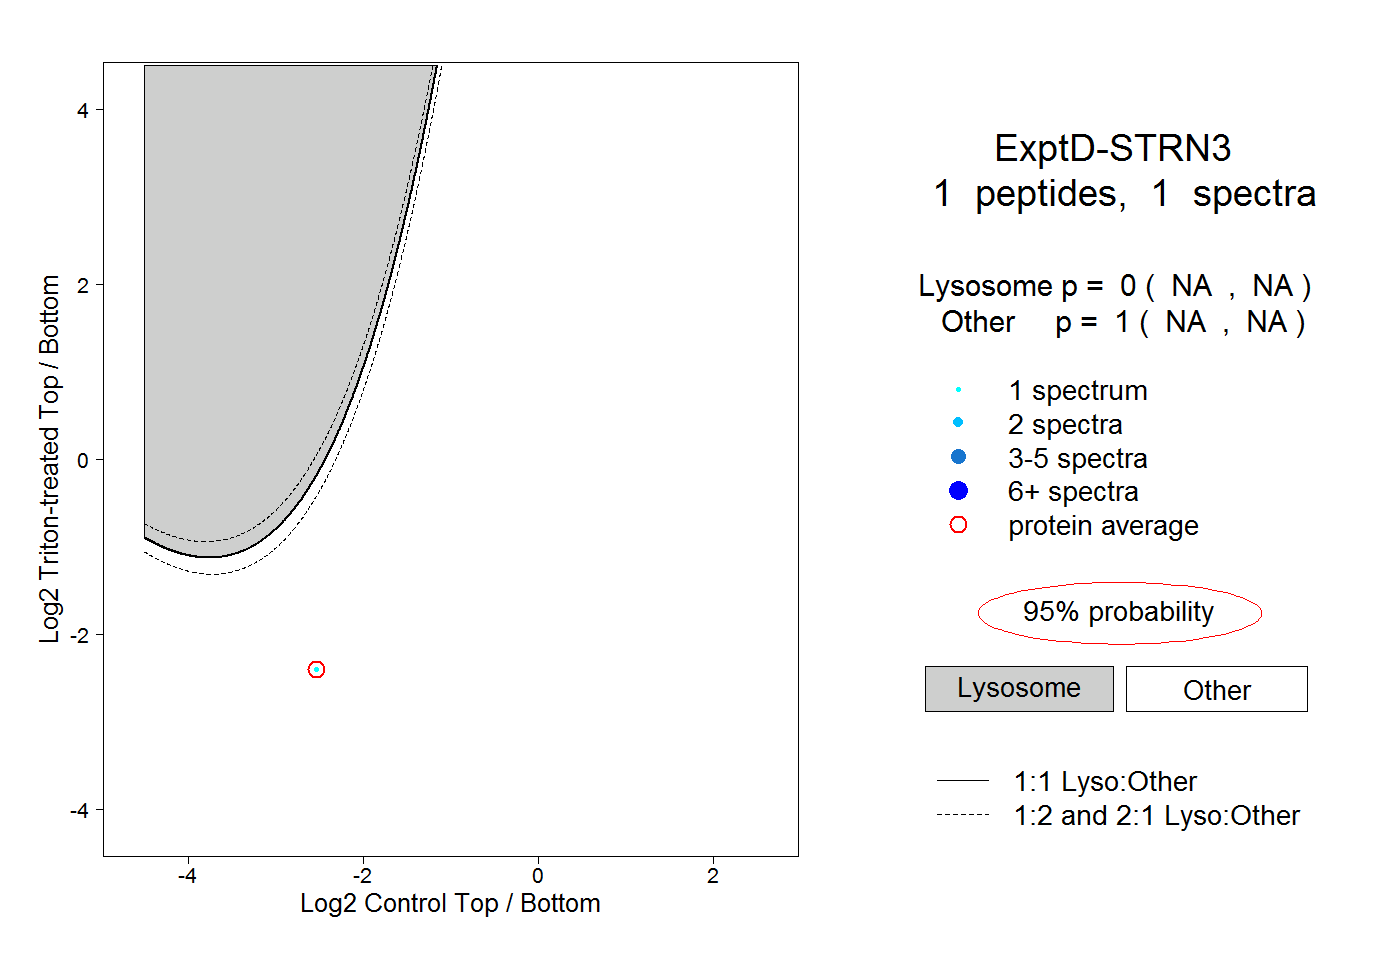
NA | NA
NA | NA