GNA11
[ENSRNOP00000007498]
Main page
| | | Plot |
Mito |
Lyso |
|
Perox |
ER |
Golgi |
PM |
Cytosol |
Nucleus |
|
| Expt A |
 4
4
peptides |
7
spectra |
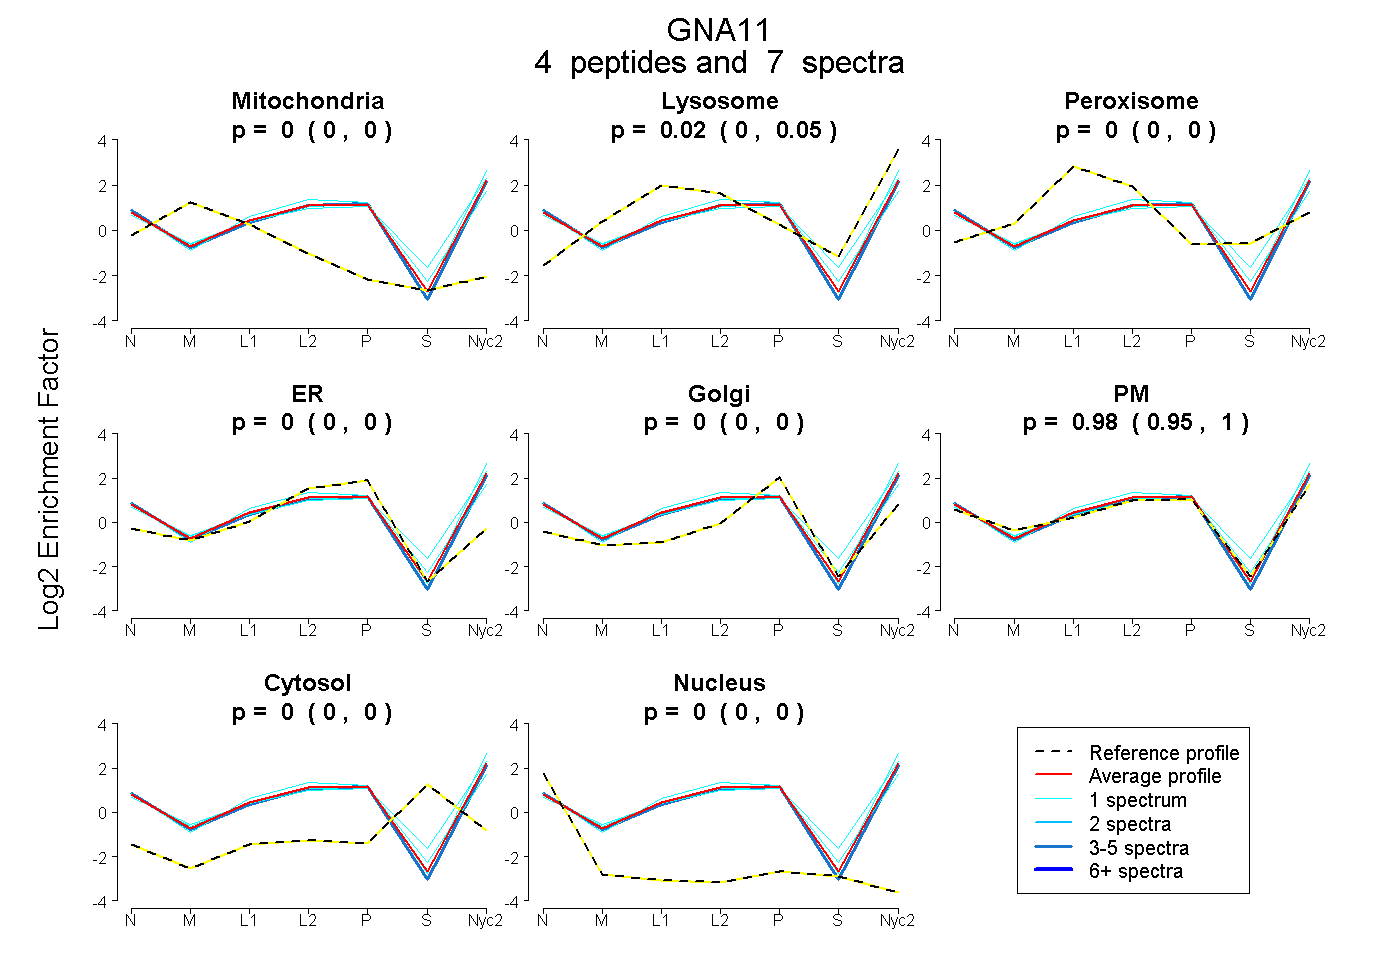 |
0.000
0.000 | 0.000 |
0.019
0.000 | 0.046 |
|
0.000
0.000 | 0.000 |
0.000
0.000 | 0.000 |
0.000
0.000 | 0.000 |
0.981
0.949 | 1.000 |
0.000
0.000 | 0.000 |
0.000
0.000 | 0.000 |
|
| | | Plot |
Mito |
|
Lyso or Perox |
|
ER |
Golgi |
PM |
Cytosol |
Nucleus |
|
| Expt B |
3
peptides |
5
spectra |
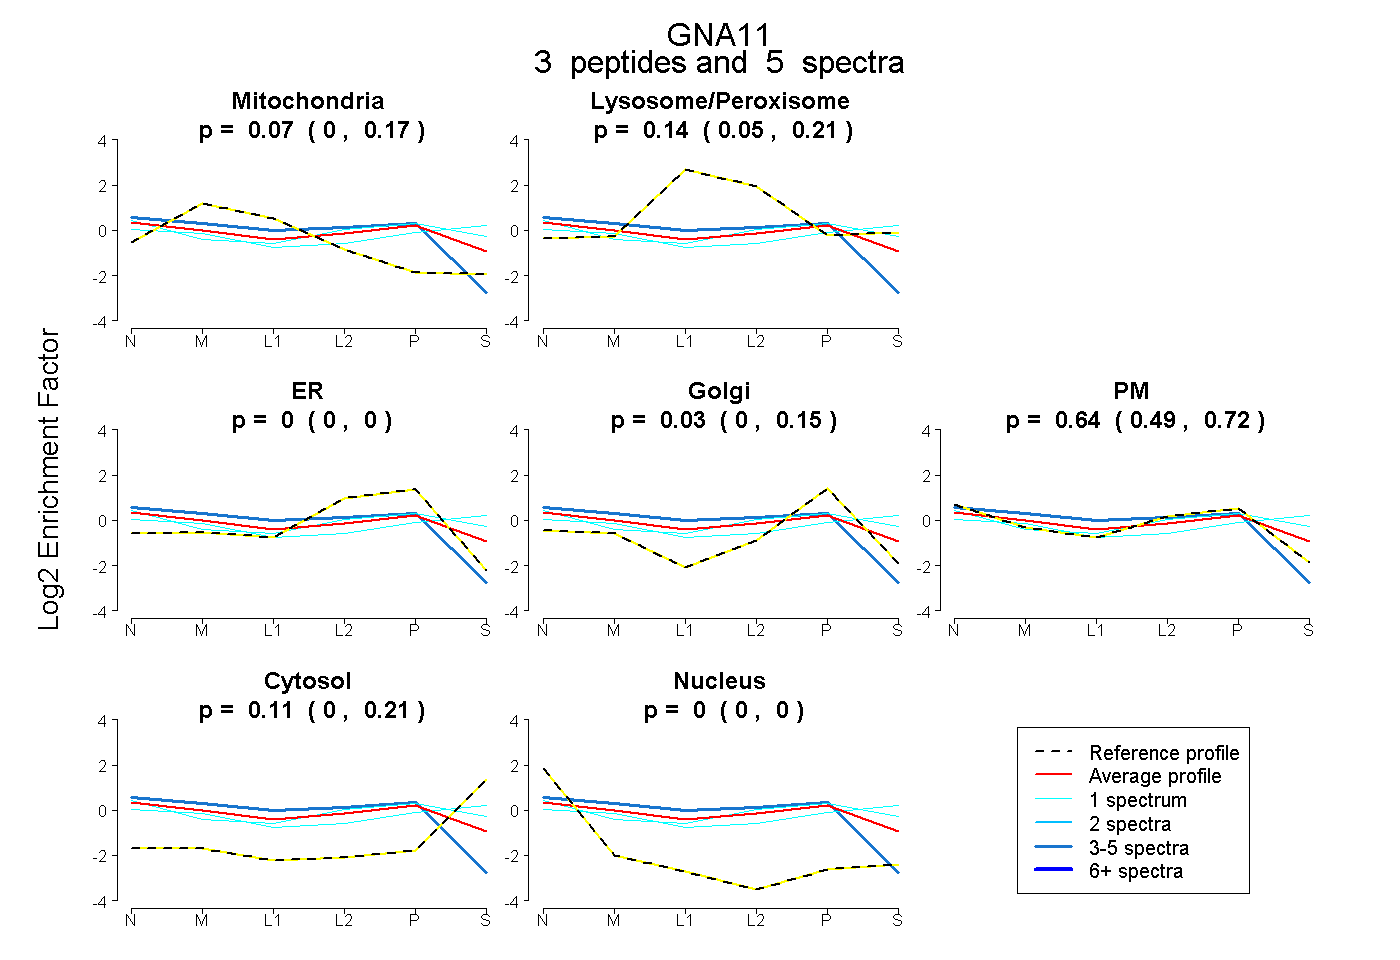 |
0.071
0.000 | 0.174 |
|
0.137
0.050 | 0.212 |
|
0.000
0.000 | 0.000 |
0.034
0.000 | 0.148 |
0.645
0.489 | 0.717 |
0.113
0.000 | 0.206 |
0.000
0.000 | 0.005 |
|
| 1 spectrum, EFQLSDSAK |
0.000 |
|
0.165 |
|
0.000 |
0.000 |
0.472 |
0.362 |
0.000 |
|
| 1 spectrum, DLLEDK |
0.000 |
|
0.182 |
|
0.000 |
0.000 |
0.607 |
0.211 |
0.000 |
|
| 3 spectra, ANALLIR |
0.241 |
|
0.000 |
|
0.154 |
0.000 |
0.605 |
0.000 |
0.000 |
|
| | | Plot |
|
Lyso |
|
|
|
|
|
|
|
Other |
| Expt C |
12
peptides |
74
spectra |
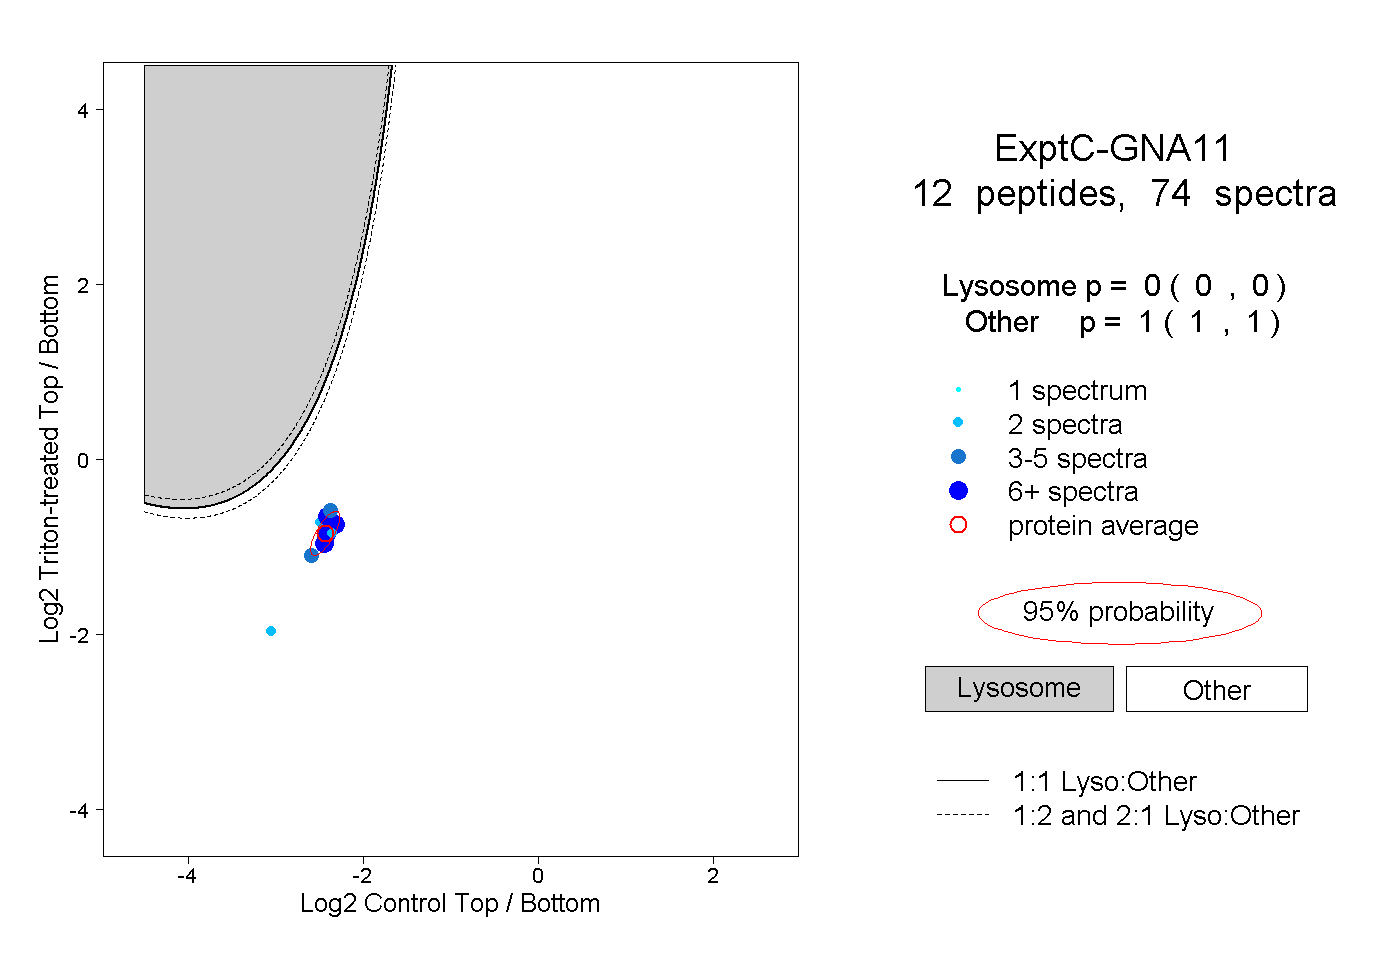 |
|
0.000
0.000 | 0.000 |
|
|
|
|
|
|
|
1.000
1.000 | 1.000 |
| | | Plot |
|
Lyso |
|
|
|
|
|
|
|
Other |
| Expt D |
3
peptides |
4
spectra |
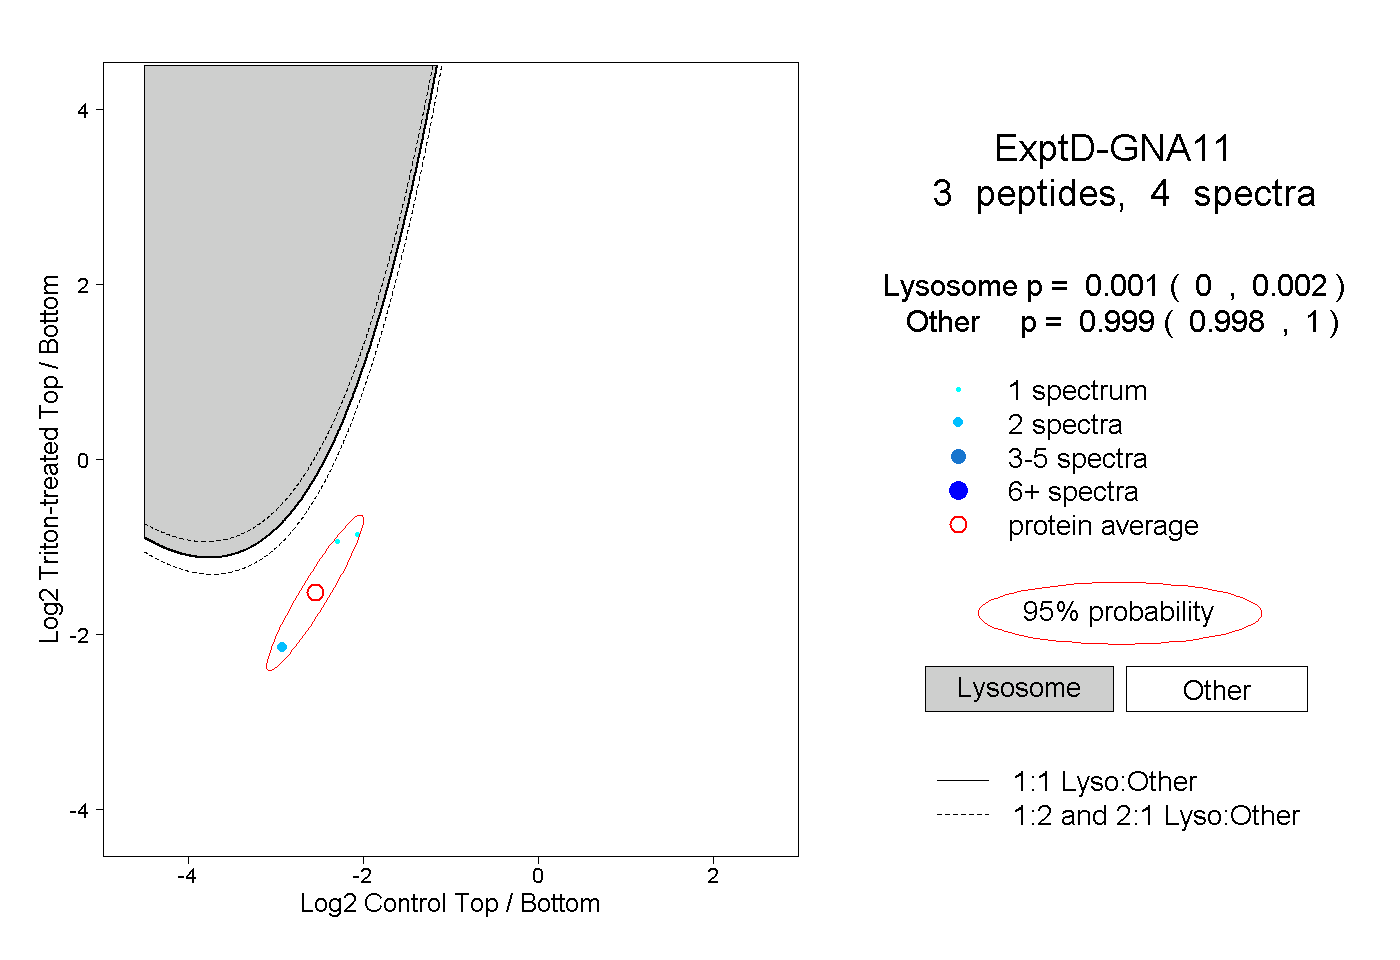 |
|
0.001
0.000 | 0.002 |
|
|
|
|
|
|
|
0.999
0.998 | 1.000 |