 6
6peptides
spectra
0.189 | 0.307
0.000 | 0.000
0.000 | 0.040
0.060 | 0.126
0.000 | 0.000
0.000 | 0.000
0.590 | 0.650
0.000 | 0.056
| Plot | Mito | Lyso | Perox | ER | Golgi | PM | Cytosol | Nucleus | |||||
| Expt A |
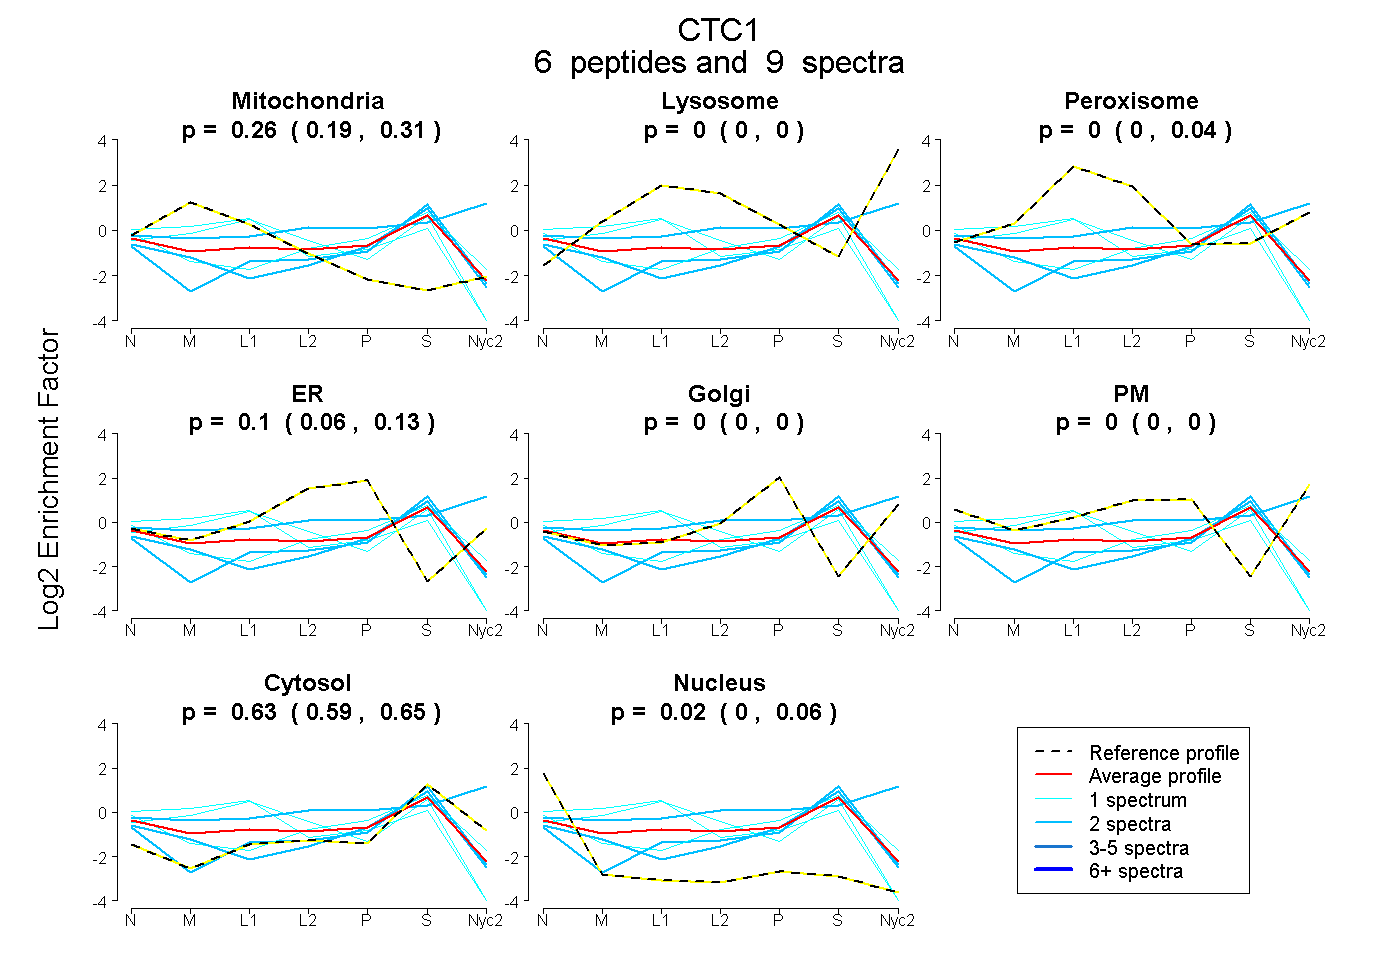
6 peptides |
9 spectra |
|
0.262 0.189 | 0.307 |
0.000 0.000 | 0.000 |
0.000 0.000 | 0.040 |
0.096 0.060 | 0.126 |
0.000 0.000 | 0.000 |
0.000 0.000 | 0.000 |
0.626 0.590 | 0.650 |
0.016 0.000 | 0.056 |
| 1 spectrum, ALEELVYK | 0.636 | 0.000 | 0.000 | 0.000 | 0.000 | 0.000 | 0.350 | 0.014 | ||
| 1 spectrum, LIGCLVR | 0.024 | 0.000 | 0.000 | 0.192 | 0.000 | 0.000 | 0.668 | 0.116 | ||
| 2 spectra, GAGPGGSVLPR | 0.000 | 0.000 | 0.000 | 0.020 | 0.000 | 0.000 | 0.836 | 0.144 | ||
| 2 spectra, RPCDITPIEPPR | 0.000 | 0.228 | 0.031 | 0.000 | 0.000 | 0.317 | 0.424 | 0.000 | ||
| 1 spectrum, LCPHVLR | 0.530 | 0.000 | 0.041 | 0.000 | 0.000 | 0.000 | 0.430 | 0.000 | ||
| 2 spectra, VIRPGVCLELR | 0.113 | 0.000 | 0.000 | 0.008 | 0.000 | 0.000 | 0.724 | 0.155 |